Statistical analysis is essential for making data-driven decisions, and the z-score is one of the most vital metrics for understanding data distribution. However, manually calculating z-scores can be an arduous and error-prone process. Fortunately, Excel provides easy-to-use functions that can automate z-score calculation and simplify statistical analysis.
In this comprehensive guide, we will walk through the fundamentals of z-scores and demonstrate step-by-step how to find z-scores in Excel using the powerful AVERAGE, STDEV.P, and mathematical operators. Whether you need to quantify outliers, identify trends, or standardize datasets for comparison, calculating z-scores in Excel unlocks deeper statistical insights.
We will cover the essential statistical concepts including defining the mean and standard deviation, structuring your dataset, writing formulas for z-score calculation, and extending the formulas across columns.
With the ability to efficiently derive z-scores, you can better understand the spread of data and pinpoint anomalies. Follow along as we demystify z-score calculation and transform Excel into your go-to tool for insightful statistical analysis.
What is a Z-Score?
Before diving into Excel formulas and calculations, let’s grasp the concept of a Z-score. The Z-score, also known as the standard score, is a dimensionless number that indicates how far a particular data point is from the mean of a dataset, measured in terms of standard deviations.
It’s a crucial tool in statistics and finance to evaluate and compare data points. In the context of finance, Z-scores are primarily used for credit risk assessment, predicting bankruptcy, and evaluating investment opportunities.
Why Mastering Z-Score Calculation Matters
Understanding and mastering Z-score calculation is essential for various professionals, including financial analysts, investors, auditors, and even business owners. Here are some key reasons why it matters:
1. Assessing Credit Risk
For lenders and financial institutions, assessing the creditworthiness of individuals and businesses is paramount. A low Z-score may indicate a higher likelihood of default, while a high Z-score suggests lower credit risk.
2. Predicting Bankruptcy
Z-scores are widely employed to predict the likelihood of a company going bankrupt. By analyzing financial data, investors and creditors can make informed decisions about their investments and loans.
3. Investment Decisions
Investors can use Z-scores to evaluate the financial health and stability of potential investment opportunities. It helps in identifying companies with strong financial positions.
4. Internal Financial Analysis
Business owners and financial analysts can use Z-scores to assess their own company’s financial health and identify areas that require attention or improvement.
Now, let’s move on to mastering the Z-score calculation in Excel.
Demystifying Z-Score: The Basics
To grasp Z-Score calculation, you need to have a basic understanding of statistics. The Z-Score formula is expressed as follows:
Z = (X – µ) / σ
Let’s break down the components of this formula:
- Z: The Z-Score value.
- X: The value you want to standardize.
- µ: The mean of the dataset.
- σ: The standard deviation of the dataset.
In simpler terms, the Z-Score helps you quantify how far a data point deviates from the mean. To calculate it, subtract the mean from the data point and then divide the result by the standard deviation.
Preparing for Z-Score Calculation
Before diving into Z-Score calculation, you need a dataset with known mean and standard deviation values. Let’s see how to calculate these essential components in Excel:
Calculating Mean with AVERAGE Function
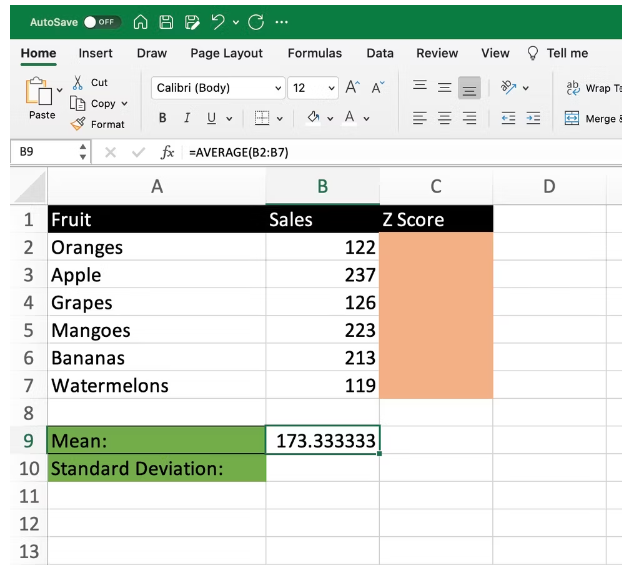
To find the mean of a dataset, use the AVERAGE function in Excel. For instance, if your data range is from B2 to B7, use the formula:
=AVERAGE(B2:B7)
For our example dataset, the mean value is approximately 173.33.
Determining Standard Deviation with STDEVPA Function
To calculate standard deviation, employ the STDEVPA function in Excel. For the same data range (B2 to B7), use the formula:
=STDEVPA(B2:B7)
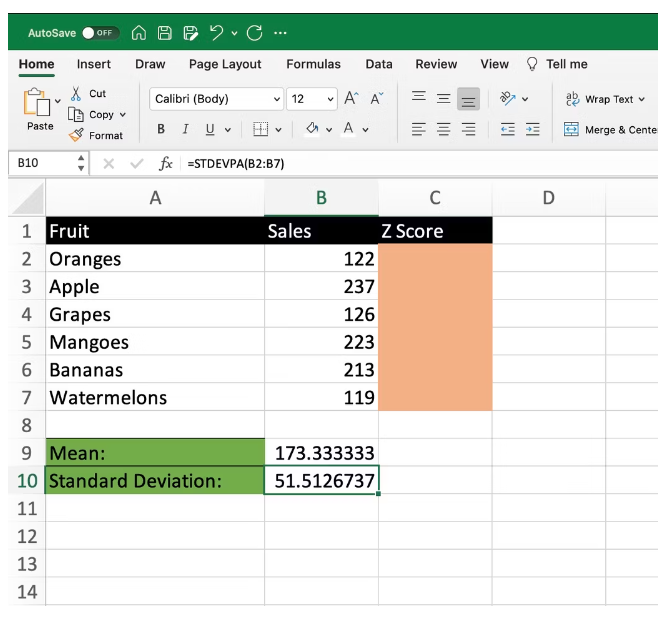
In our example, the standard deviation is approximately 51.51.
Crunching Z-Scores in Excel
Now that we have our mean and standard deviation values, we can proceed to calculate Z-Scores for each data point. The results will be displayed in the C column, adjacent to the corresponding data values in the B column.
Here’s how you calculate Z-Scores:
Z-Score = (Data Point – Mean) / Standard Deviation
Let’s illustrate this process using an example in Excel:
- We have a dataset representing fruit sales in columns A (fruits) and B (sales).
- To calculate the Z-Score for a specific fruit’s sales, say “oranges” with a sales value of 122, use the formula:
=(B2 – B9) / B10

In this equation, B2 represents the number of orange sales, B9 is the mean value, and B10 is the standard deviation.
The result for the first value (oranges) is approximately -0.997. You can repeat this process for all other data points, including apples, bananas, cherries, and dates.

Excel’s Versatility: Beyond Z-Scores
While Z-Scores are invaluable for statistical analysis, Excel offers a wide array of functions to simplify your data tasks. If you’re dealing with extensive datasets, consider using Excel’s XLOOKUP function to efficiently find information within tables or ranges.
Enhance Your Productivity with Z-Score in Excel
In conclusion, mastering Z-Score calculation in Excel is a valuable skill for anyone working with data analysis. While it involves mathematical concepts, it becomes second nature with practice. However, if you prefer a more straightforward approach, you can always leverage Excel’s SUMIF function for your data summarization needs.
With this newfound knowledge, you’ll be better equipped to make data-driven decisions and uncover insights that can drive success in various professional domains. Excel’s powerful features, coupled with your understanding of Z-Scores, will make you a data analysis pro in no time.