Microsoft Excel is a versatile and powerful spreadsheet tool used by millions of individuals and businesses worldwide. It offers a wide range of functionalities, making it an ideal choice for tasks like data analysis, financial management, and much more.
One common task in Excel is tallying or counting data, which can be incredibly useful in various scenarios. In this article, we will explore the step-by-step process of how to tally in Excel, understand the reasons for tallying, and provide you with some valuable tips and tricks.
Step-by-Step Guide to Tallying in Excel
Tallying in Excel can be done using various methods, depending on the data you’re working with. Let’s explore a few different approaches:
Method 1: Using COUNTIF Function
The COUNTIF function is an excellent way to tally specific items in a list or range. Follow these steps:
- Prepare Your Data: Make sure your data is organized in a column, and you know what you want to tally.
- Select a Cell for Tallying: Click on the cell where you want the tally result to appear.
- Enter the COUNTIF Formula: In the selected cell, type =COUNTIF(.
- Specify Range: Select the range or type the range reference (e.g., A1:A10) that contains the data you want to tally.
- Enter Criteria: After the range, type , and then specify the criteria you want to count. For example, if you want to tally the number of times “Apples” appear in the range, type “Apples”.
- Complete the Formula: Close the bracket ) and press Enter.

The selected cell will now display the tally count for the specified criteria.
Method 2: Using PivotTables
PivotTables are a powerful way to summarize and tally data. They are particularly useful for more extensive datasets and complex tallies. Here’s how you can use PivotTables:
- Prepare Your Data: Ensure your data is organized with column headers.
- Select Your Data: Highlight the range of data you want to tally.
- Create a PivotTable: Go to the “Insert” tab, select “PivotTable,” and choose where you want to place the PivotTable.
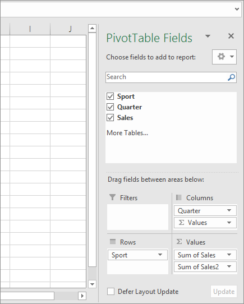
- Configure the PivotTable: Drag and drop your data fields into the appropriate sections. For example, if you want to tally the number of sales for each product, drag the “Product” field to the “Rows” section and the “Sales” field to the “Values” section.
- Customize the PivotTable: You can further customize the PivotTable by applying filters, sorting, and other formatting options to get the desired tally.
Method 3: Using Filters
Excel’s built-in filter feature allows you to filter data and quickly count the items you want. Here’s how to do it:
- Prepare Your Data: Make sure your data is well-organized with column headers.
- Apply a Filter: Click on any cell within your dataset, go to the “Data” tab, and select “Filter.”
- Filter Data: Use the filter drop-downs in your column headers to filter the data based on your criteria. For example, if you want to tally “High Priority” tasks, select “High Priority” from the filter drop-down.
- Observe Tally: The filtered list will display the tally count at the bottom of the Excel window.

Method 4: Conditional Formatting
Conditional formatting can be used to visually tally data based on specific criteria. Here’s how you can set it up:
- Prepare Your Data: Ensure your data is organized in a column with a clear criteria column.
- Select the Data: Highlight the range of data you want to apply conditional formatting to.
- Apply Conditional Formatting: Go to the “Home” tab, select “Conditional Formatting,” and choose “New Rule.”
- Set a Formula: Choose “Use a formula to determine which cells to format.” In the formula bar, enter a formula that evaluates to TRUE or FALSE based on your criteria. For example, if you want to tally all sales above $500, the formula might be =B2>500 (assuming your sales data is in column B).
- Choose Formatting: Click on the “Format” button and set the formatting you want to apply to the cells that meet the criteria.
- Confirm the Rule: Click “OK” to confirm the rule.
Excel will apply the conditional formatting to the cells that meet your criteria, making it easy to visually tally the data.
Reasons to Tally in Excel
Tallying in Excel can be incredibly beneficial in various scenarios. Here are some of the key reasons why you might want to use Excel for tallying:
1. Data Analysis
Excel is a popular tool for data analysis. Tallying helps you summarize data and identify patterns and trends quickly. For example, you can tally the number of sales for each product to determine which products are the best-sellers.
2. Inventory Management
Businesses often use Excel for inventory management. Tallying can help keep track of the quantity of items in stock, making it easier to reorder products when they are running low.
3. Task Management
Individuals and teams can use Excel for task management. Tallying tasks by status (e.g., open, in-progress, completed) allows you to see the overall progress of a project.
4. Financial Analysis
Excel is widely used for financial analysis and budgeting. Tallying expenses or income categories helps in budget tracking and financial planning.
5. Quality Control
In manufacturing and quality control processes, tallying can be used to track defects, errors, or deviations from the desired standard.
Tips and Tricks for Tallying in Excel
To make your tallying tasks in Excel more efficient, consider these tips and tricks:
1. Use Descriptive Headers
When working with data, it’s essential to have clear and descriptive headers for your columns. This makes it easier to understand the data and select the correct criteria when tallying.
2. Organize Your Data
Keep your data organized and consistent. Data in Excel should be structured logically, making it easier to apply tallying methods.
3. Conditional Formatting for Visual Tallying
Conditional formatting not only helps you tally data but also provides a visual representation of your tally. This can be especially useful when you need to quickly identify patterns.
4. PivotTable Filtering
In PivotTables, use filters to drill down into specific data subsets. This allows you to perform tallies on different aspects of your dataset without altering the original data.
5. Dynamic Ranges
If your data is continuously changing, consider using dynamic ranges like Excel Tables or named ranges. This ensures that your tally formulas or PivotTables automatically adjust to include new data.
6. Keyboard Shortcuts
Learn keyboard shortcuts for tallying functions. For example, you can use Ctrl + Shift + L to apply or remove filters quickly.
7. Practice Regularly
The more you practice tallying in Excel, the more proficient you’ll become. Explore different methods and experiment with various data scenarios to improve your skills.
8. Check for Errors
Always double-check your tally results for accuracy. Data entry errors or incorrect criteria can lead to inaccurate tallies.
Conclusion
In conclusion, tallying in Excel is a fundamental skill that can be applied in various personal and professional scenarios. Whether you’re managing data, analyzing information, or tracking progress, Excel’s tallying capabilities can streamline your tasks. By following the step-by-step methods, understanding the reasons for tallying, and implementing the tips and tricks, you can become proficient in using Excel for tallying and make your data-driven tasks more efficient and insightful.