Whether you’re a seasoned data analyst or a newcomer to the world of spreadsheets, dealing with outliers is an essential skill that can significantly impact the accuracy and reliability of your insights.
Outliers, those pesky data points that deviate significantly from the norm, can wreak havoc on statistical analyses, skewing results and leading to erroneous conclusions. In this in-depth blog post, we will unravel the mystery of outliers and equip you with a diverse set of techniques to identify, assess, and appropriately eliminate outliers from your datasets using Excel.
From fundamental concepts to step-by-step tutorials, we empower you with the knowledge and tools you need to handle outliers like a pro, ensuring that your data-driven decisions are based on a solid and dependable foundation. So, let’s embark on this journey to refine your analytical skills and elevate your Excel prowess as we navigate the intriguing realm of outlier management together.
Method 1: Automated Outlier Removal using Formulas
Step 1: Identifying Outliers
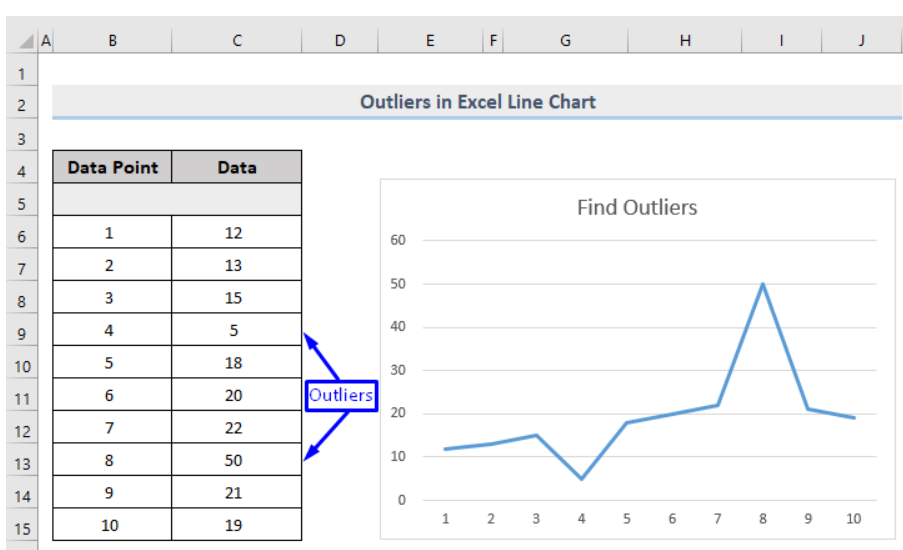
Before we embark on our journey to remove outliers, it’s essential to identify them. Outliers can be identified through visual aids like scatter plots or line charts. These visualizations can highlight data points that deviate significantly from the expected pattern.
Step 2: Constructing the Formula
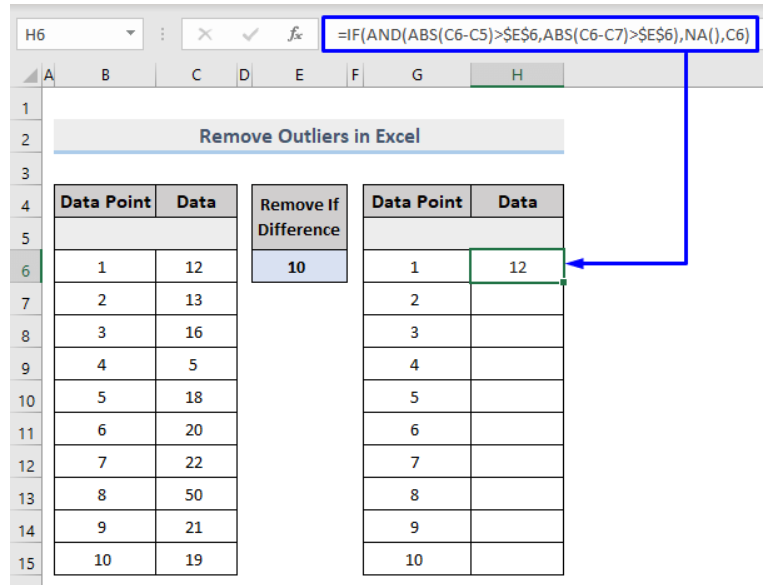
In an empty cell (such as Cell H6), we’ll construct a formula that intelligently detects and removes outliers. The formula goes as follows:
=IF(AND(ABS(C6-C5)>$E$6,ABS(C6-C7)>$E$6),NA(),C6)
Here’s what each element represents:
- C6: The data point under consideration
- C5: The data point immediately above C6
- C7: The data point immediately below C6
- $E$6: The threshold value for outlier detection
Imagine you’ve determined that a data point deviating by 10 units or more is an outlier. In Cell E6, input the value 10. The use of an Absolute Cell Reference ensures consistency throughout the dataset.
Step 3: Implementing the Formula
Upon entering the formula, press Enter. Observe as the result materializes in cell H6.
The genius of this formula lies in its scalability. Copy it using the Fill Handle tool, effortlessly applying it to the entire dataset.
Step 4: Extending the Formula
Drag the formula down using the Fill Handle. Witness as the cells harboring outliers are gracefully replaced with #N/A, effectively banishing them from your dataset.

Step 5: Visualizing the Transformation
Return to your line chart. Behold the metamorphosis – a harmonious curve that no longer bears the burden of disruptive outliers.

Method 2: Manual Outlier Removal
Step 1: Taming the Data
For datasets of more manageable proportions, a manual approach can be surprisingly effective. Begin by selecting the dataset you intend to cleanse.
Step 2: Harnessing the Power of Sorting
The next step involves sorting your dataset. Navigate to the “Sort & Filter” option nestled within the “Editing” group. Choose your preferred sorting order – either “Smallest to Largest” or “Largest to Smallest.”

Step 3: Bid Farewell to Outliers
As the dataset gets sorted, the outliers reveal themselves. The smallest values ascend to the top, while the largest ones find their refuge at the bottom.

Now, with surgical precision, manually excise these outliers from your dataset.
A word of caution: while manual outlier removal is swift for smaller datasets, its feasibility dwindles as dataset size increases. Tedious and error-prone, this method is best reserved for cases where clarity and simplicity reign.
Tips for Outlier Management and Beyond
1. Embrace Visualization
Visualizing your data through graphs and charts can be immensely enlightening. These visual aids expose outliers and grant you a deeper understanding of your dataset’s intricacies.
2. Robust Threshold Selection
Choosing the appropriate threshold for outlier detection is paramount. Consult domain knowledge, statistical insights, and the nature of your data to make an informed decision.
3. Automated Tools
Excel offers an array of automated tools designed to spot outliers. Explore functions like Z-Score and IQR (Interquartile Range) for a data-driven approach to outlier detection.
4. Context Matters
Consider the context of your analysis. Outliers might signify critical insights or data entry errors. Scrutinize their relevance before removal.
In Conclusion
Bid adieu to the distortion outliers introduces to your data. Armed with automated formulas and manual finesse, you possess the means to tame unruly data and extract pure, unadulterated insights.
Whether you choose the streamlined path of formulas or the meticulous route of manual removal, the outcome is the same: accurate, reliable, and potent data that fuels your analytical pursuits.
Excel’s capabilities are vast, and your proficiency in outlier removal is the key to unlocking its full potential. As you journey through the realm of data analysis, let these techniques be your guiding light, illuminating the path to excellence.