How to remove gridlines in Excel Chart? Do you have any idea how would you do it?
Basically, gridlines are horizontal or vertical lines present on Excel spreadsheets that mutually make cells and then rows/columns. Sometimes these lines seem to be fine, whereas there might be instances when you need to hide them. Similarly, when you make charts in Excel, the gridlines always show up that can be removed easily. The Chart Tools ribbon lets you remove these lines so that your sheet looks the way you need.
Usually, gridlines align your data values that appear by default on Excel sheets. Let’s have a look at how you can manage the settings to remove gridlines in an Excel chart.
How to Remove Gridlines in Excel Chart with Delete Key or Delete Option?
With the help of the delete key, you can easily remove the gridlines in the Excel chart. For this, you just need to follow the simple steps given below:
- First, you need to select gridlines by clicking on them. Leave the first gridline.
- Now, right-click and choose the Delete button from the context menu.
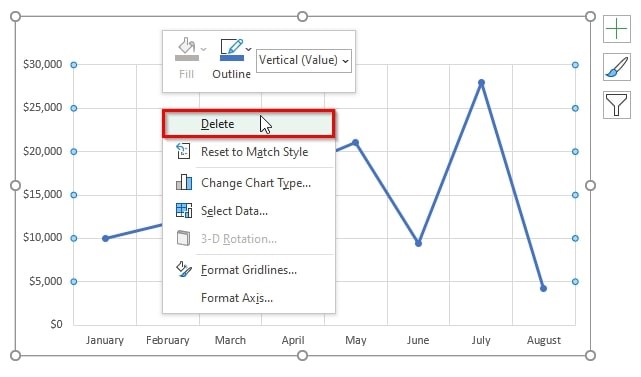
- Or else, you can select the Vertical Axis Major Gridlines so that vertical gridlines can be removed.
- Now, press the Delete key from the keyboard.
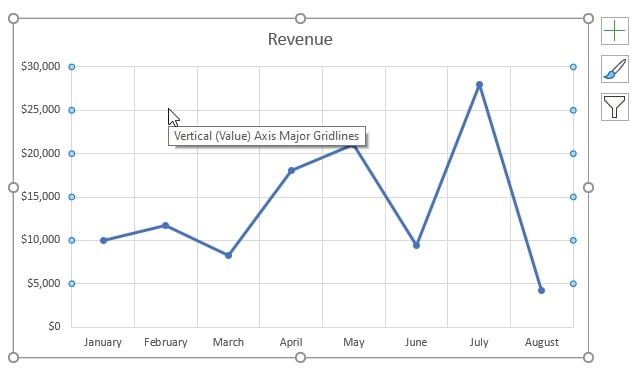
- In case, you need to remove horizontal lines, click on the Horizontal Axis Major Gridlines and then press the Delete key from the keyboard.

- You will notice the gridlines have now vanished from the chart on the sheet.

How to Remove Gridlines in Excel Chart with Chart Element?
With the help of the chart element, you can remove the gridlines from the Excel chart easily. For this, below are the steps to follow:
- Click on the Graph and open the Chart Design option from the ribbon.
- Now, choose the Add Chart Element option given in the drop-down menu. Menu you will find under the Chart Layouts group.
- Click on the Gridlines and choose Primary Major Horizontal or Primary Major Vertical as per the gridlines you need to remove.

- Furthermore, you can click on the Plus (+) symbol that shows the Chart Elements.
- Now, you need to uncheck the field box in which you see gridlines.

That’s it! You will notice the gridlines are removed completely from the graph.

How to Remove Gridlines in Excel Chart with Format Gridlines Option?
Other than the above method, you can employ this trick as well in which format gridlines option is used.
- Right-click on one of the gridlines and leave the first gridline.
- Choose the Format Gridlines option and check the No line option.


- To make gridlines appear once again, open the above dialog box and analyze other options in the Line Color group.
- Note that you cannot use this method in Excel 2007.
How to Remove Gridlines in Excel Chart with VBA?
VBA lets you execute multiple functions exactly the way you need. VBA coding provides options that you can choose from according to the function. Let’s have a look at some easy-to-follow steps to remove gridlines from an Excel chart:
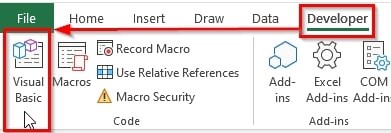
- First, open the Developer tab located in the ribbon.
- Click on the Visual Basic option from the Code menu. It will open the Visual Basic Editor. As an alternative, you can press ALT + F11 to open the Visual Basic Editor.
- Right-click on the sheet and open the View Code option, it will open up the Visual Basic Editor.
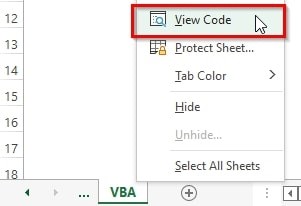
- In this window, you can write the codes.
- Click on Module from the Insert drop-down menu.
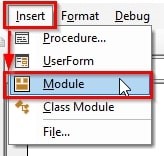
- You will find a Module in the workbook.
- Now, simply copy and paste the VBA code given below:
VBA Code:
Sub Remove_Gridlines()

Dim a As Axes

Dim wsht As Worksheet

Dim ChtObj As ChartObject

For Each wsht In Worksheets

    wsht.Activate

        For Each ChtObj In wsht.ChartObjects

            With ChtObj.Chart

                For Each a In ChtObj.Chart

                    .Axes.HasMajorGridlines = False

                    .Axes.HasMinorGridlines = False

                Next a

            End With

       Next ChtObj

  Next wsht

End Sub
Now, click on the RubSub button to run the code. Or press F5.
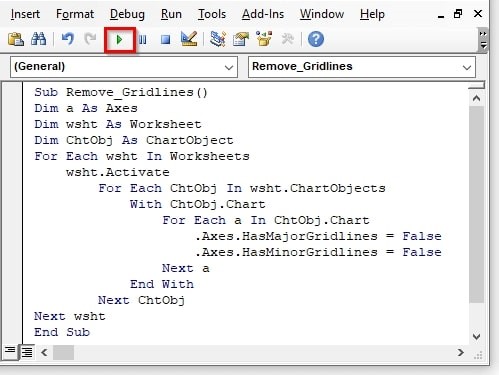
It will remove all the gridlines in the Excel graph from the sheet in front of you.
Let’s Wrap Up:
In this post, you learned how to remove gridlines in Excel Chart by using multiple methods including the Delete key or Delete button, Chart Element, Format Gridlines, and VBA Macro. All these methods are super effective and useful that’s why you can choose any of them to practice. Keep exploring Excel!