From basic calculations to intricate data analysis, Excel provides a plethora of features that simplify and enhance our workflow. Among these features, conditional formatting shines as a way to visualize and highlight data based on specific criteria.
However, there are times when you need to undo or remove conditional formatting to revert your spreadsheet to its original state or make other changes. In this guide, we’ll walk you through the process of efficiently removing conditional formatting in Excel, step by step.
Using the Quick Analysis Tool Option for Clearing Conditional Formatting
When it comes to quickly clearing conditional formatting from selected cells, there’s a convenient method at your disposal: the Quick Analysis tool option. This tool offers a seamless way to remove conditional formatting without the need for elaborate steps.
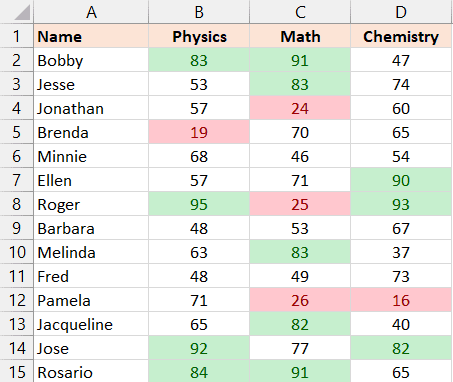
Just for instance below is an example dataset that we will use in our tutorial. In this dataset, we have implemented conditional formatting for student scores that need to be removed.
Here’s how it works:
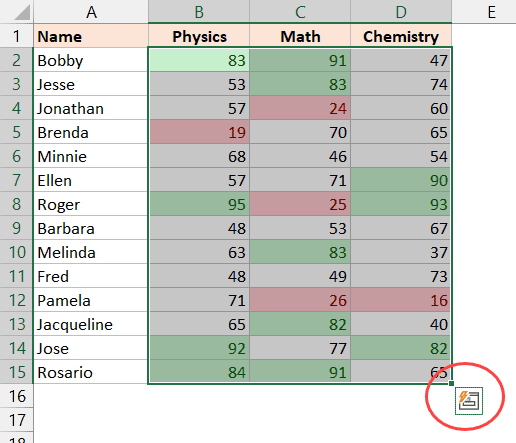
- Select the Range: Begin by selecting the range of cells that you wish to remove the conditional formatting from. Upon making the selection, you’ll notice the Quick Analysis tool icon appearing at the bottom right corner of the selected area.
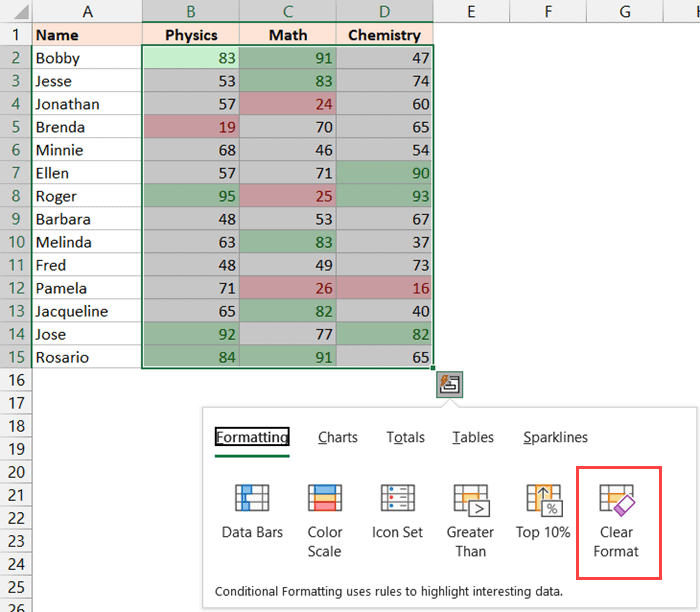
- Access the Quick Analysis Tool: As the icon appears, click on it to open the Quick Analysis tool. This tool presents you with a variety of formatting and analysis options.
- Choose “Clear Formatting”: Among the options presented by the Quick Analysis tool, locate and select the “Clear Formatting” option. With just a simple click, the conditional formatting applied to the selected cells will be removed.
It’s worth noting that this method exclusively removes conditional formatting from the cells. Any other formatting elements, such as fill colors, borders, font styles, and more, will remain intact. This focused approach ensures that your data maintains its core presentation while eliminating the conditional formatting effects.
Bonus Tips for Effective Formatting Management
As you become more proficient in managing conditional formatting, consider these bonus tips to further streamline your Excel experience:
- Utilize “Undo” Functionality: Remember that Excel offers the “Undo” feature, allowing you to reverse actions, including formatting changes. This can be especially handy if you accidentally remove formatting that you intended to keep.
- Experiment with Formatting Styles: While removing conditional formatting is useful, don’t hesitate to explore different formatting styles to make your data visually appealing and easy to interpret.
- Combine Formatting Techniques: To achieve advanced formatting effects, consider combining conditional formatting with other Excel features, such as data bars, color scales, and icon sets.
Enhancing Data Analysis with Excel’s Conditional Formatting
Conditional formatting goes beyond merely changing the appearance of cells; it has the power to enhance your data analysis capabilities significantly. By using this feature strategically, you can uncover insights and trends that might otherwise go unnoticed. Here are some advanced applications of conditional formatting that you can explore:
- Highlighting Data Discrepancies: Conditional formatting can be employed to highlight discrepancies between datasets. For instance, you can compare two sets of numbers and use formatting to emphasize differences, making it easier to spot outliers.
- Visualizing Trends: When dealing with large datasets, identifying trends can be challenging. By applying gradient color scales through conditional formatting, you can create visual representations of trends, making it easier to understand patterns in your data.
- Setting Thresholds: Conditional formatting can help you set thresholds for data points. For example, you can use color coding to differentiate between data points that meet a certain target and those that fall below it.
- Data Validation: Conditional formatting can be used in conjunction with data validation rules to ensure data accuracy. If data entered doesn’t meet specified criteria, conditional formatting can alert users with color changes.
Expanding Your Excel Expertise
As you continue to explore the depths of Excel’s capabilities, it’s worth delving into other features that can complement and elevate your data management skills:
- PivotTables: PivotTables allow you to summarize and analyze large datasets quickly. They provide a dynamic way to reorganize and consolidate information for easier analysis.
- Formulas and Functions: Excel’s extensive library of formulas and functions empowers you to perform complex calculations and data manipulations. Functions like VLOOKUP, SUMIF, and COUNTIF can significantly streamline your tasks.
- Data Visualization Tools: In addition to conditional formatting, Excel offers various data visualization tools, such as charts and graphs. These tools enable you to present your data in a visually appealing and insightful manner.
Wrapping Up
In conclusion, Excel’s conditional formatting enhances the way we interact with data, but knowing how to remove it when necessary is equally crucial. The Quick Analysis tool option provides a swift and focused method for clearing conditional formatting, allowing you to maintain your data’s core presentation while eliminating specific formatting effects. By mastering this technique, you can efficiently manage your Excel spreadsheets and harness the full potential of your data.