Tables are a handy feature in Excel that allows you to analyze, explore, and display data in a structured format. But if you’re new to Excel, you may be wondering—how do you actually create a table? In this comprehensive guide, we’ll walk through the steps to make tables in Excel using shortcuts and commands, formatting and styling tables, adding total rows and formulas, expanding tables automatically, and effectively using them for data analysis.
Why Use Tables in Excel?
Before learning how to create tables, it helps to understand why they are valuable:
- Structured references – Tables allow you to reference data using names like Table [Sales] instead of cell locations. This makes formulas easier to understand.
- Quick formatting – Turn plain data into professional, formatted tables with just a click.
- Sorting and filtering – Easily sort, filter, and analyze table data.
- Dynamic updating – Formulas and charts linked to tables update instantly when you change table data.
- Automatic expansion – New data added to tables expand their structured references automatically.
- Simpler data management – Features like total rows and color formatting help explore and work with datasets.
For organizing and analyzing data in Excel, tables should be a core part of your toolkit.
How to Create a Table
The easiest way to create a table is using Excel’s Format as Table command. To do this:
- Select any cell in the data range you want to convert to a table.
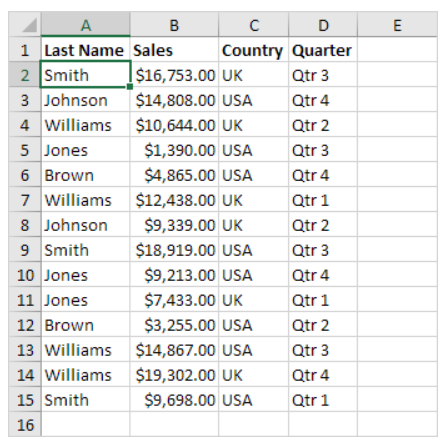
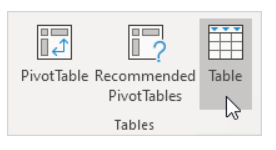
- On the Insert tab, click the Table button.
- Check the box to indicate the data contains headers.
- Click OK to format the range as a table.
That’s it! Your plain data now has table formatting and features applied.

Alternatively, you can format the shortcut Ctrl + T as a table.
Table Creation Dialog Options
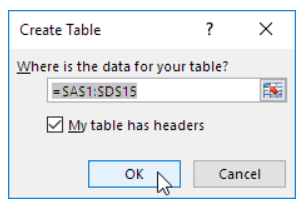
In the Create Table dialog, you have a few key options:
- My table has headers – Check if your data has column headers to include them in the table structure.
- Table style – Select from predefined color and formatting table styles.
- Where is the data – Modify the automatically selected data range if needed.
Take a moment to ensure these are configured correctly when creating a table.
Modify and Style Tables
Once created, you can customize tables in several ways:
- Table Design tab – Manage table styles, filters, totals, and more from a dedicated toolbar.
- Table Styles – Change the color theme and formatting of tables from built-in style sets.
- Resize – Drag the bottom right corner to add more rows and columns to a table.
- Rename – Edit the default Table1, Table2 name to something more meaningful.
Proper table design makes data stand out and improves readability.
Add a Totals Row
Total rows perform calculations like SUM, AVERAGE, COUNT, and more for a column. To add:
- On the Table Design tab, check Total Row.

- Click in the total row cell, and select the desired calculation from the dropdown.

Excel tables automatically apply the SUBTOTAL function when filtering to ensure correct calculation.
Refer to Tables in Formulas
Table data can be referenced in formulas in a few ways:
- Table name – Use the table name like =Table1[[Sales]] to reference the entire Sales column.
- @ symbol – Use @ like =AVERAGE(@Table2[Cost]) to aggregate table data.
- Structured references – Easier formula building with intuitive names like =[@SalePrice]-[@Cost].
This provides more robust formulas that don’t break when data changes.
Expand Tables Automatically
As you add new data adjacent to a table, use the shortcut Ctrl + Shift + * to expand the table to include new rows/columns.
The structured references and table style are automatically applied without rebuilding formulas. This makes data maintenance easy.
Link Table Data into PivotTables
To analyze table data in a PivotTable:
- Click any cell in the table.
- On the Insert tab, click PivotTable and select “Use This Table” in the dialog.
The entire table will appear as a field list for dynamic reporting.
Additional Table Tips and Tricks
- Use table names in formulas outside the table like =SUM(Table1[Sales])
- Reference your table in named ranges for use in validations or charts.
- Disable table autoexpansion if you want to manually control table size.
- Convert table to range with Transform to Range when no longer needed.
- Use Ctrl + T to create quick one-click tables from ad-hoc data.
Get the most from Excel tables with these additional features and capabilities.
Bottom Line
With this foundational knowledge, you should feel empowered to start using tables for better data management in Excel. Excel tables are well worth learning – they will take your data analysis skills to new levels. Take time to incorporate them into your spreadsheet workflow.