Microsoft Excel is a powerful tool used for data analysis and calculation, empowering businesses and individuals alike to make informed decisions based on accurate insights. One of the fundamental requirements when dealing with substantial datasets is the ability to calculate cumulative values efficiently.
The total row feature in Excel provides an effective solution to this challenge, enabling users to display sums of data in each column. In this comprehensive tutorial, we will delve into two advanced methods that demonstrate how to add a total row in Excel efficiently and effortlessly.
Method 1: Adding a Total Row in a Table
Tables in Excel offer numerous advantages, such as dynamic ranges, automatic formatting, and enhanced data manipulation capabilities. By converting your data into a table, you unlock a whole new set of functionalities, including the ability to incorporate total rows. Follow these detailed steps to add a total row within a table:
- Select Data and Convert to a Table: Before you can add a total row, you need to convert your data into a table. To do this, begin by selecting any cell within your dataset. Now, you have two options:
- Press the keyboard shortcut Ctrl + T, which instantly converts your data into a table.
- Alternatively, you can navigate to the “Insert” tab, click on “Table,” and confirm the prompt by clicking “OK.”
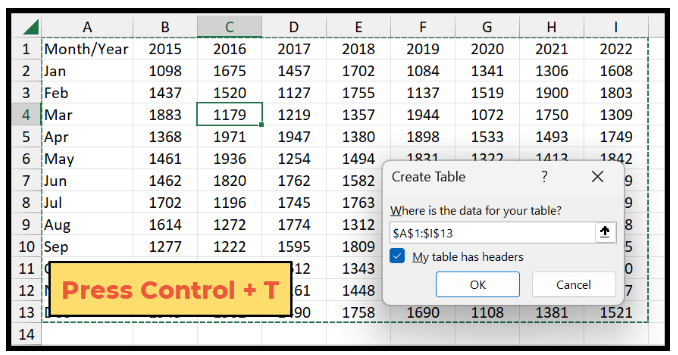
Converting your data into a table sets the stage for the subsequent steps in adding a total row.
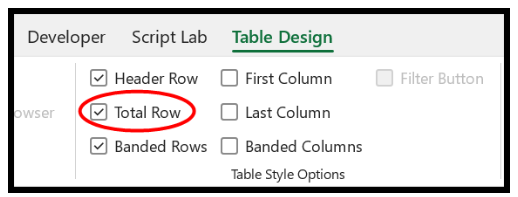
- Enable Total Row Option: With your data now transformed into a table, a new contextual tab, “Table Design,” appears in the Excel ribbon. Within this tab, you will find the “Total Row” checkbox. Mark this checkbox to activate the total row feature.
- Total Calculation: Once you enable the total row, Excel will display it at the bottom of your table. However, the initial total row will show the sum for the last column only.

To calculate the sum for each column, follow these detailed instructions:
-
- Click on the drop-down arrow at the column header of your choice.
- Select “SUM” from the options provided.

-
- Excel will automatically calculate and display the sum for that column in the total row.
- Repeat for Each Column: To obtain the total for all the columns, repeat the above process for each column in the table.

By following the above-detailed steps, you will have successfully added a total row to your Excel table, providing you with a comprehensive overview of cumulative values for each column.

Method 2: Adding a Total Row with AutoSum
Excel’s AutoSum feature is a time-saving functionality that simplifies the process of calculating sums in a selected range of cells. To add a total row using AutoSum, follow these detailed instructions:
- Select the Row: Choose the row located just below your data, where you want to add the total row.

- Apply AutoSum Function: There are two ways to use AutoSum:
- Press the keyboard shortcut Alt + = to automatically apply the AutoSum function to all cells in the selected row. This action will calculate and display the sum of each column in the total row.

-
- Alternatively, you can navigate to the “Home” tab, locate the “Editing” group, and click on the “AutoSum” button.

-
- This will produce the same result as the keyboard shortcut, adding the sum function to all cells in the row, effectively creating your total row.
The AutoSum feature is a powerful tool for quickly generating total rows, especially when working with extensive datasets.
Benefits of Using Total Rows in Excel
The inclusion of total rows in your Excel spreadsheets offers several significant advantages, streamlining data analysis and enhancing the visual representation of information. Some key benefits include:
- Quick Data Assessment: Total rows provide an at-a-glance overview of cumulative values in each column, allowing users to assess data trends and make informed decisions swiftly.
- Improved Data Accuracy: By using Excel’s built-in calculation features, such as SUM, you can rest assured that your data is accurately calculated without the risk of manual errors.
- Dynamic Updates: As you add or modify data within your table, the total row automatically updates to reflect the changes, ensuring real-time accuracy.
- Enhanced Data Visualization: Total rows contribute to better data visualization, making it easier for stakeholders to understand complex datasets.
Customizing Total Rows for More Insights
Excel provides users with the flexibility to customize total rows further, adding more insights to their data analysis process. Here are some advanced techniques to consider:
- Using Functions Other than SUM: Excel offers a wide range of functions that can be applied to total rows, such as AVERAGE, MAX, MIN, and COUNT. Depending on your data analysis requirements, you can choose the most appropriate function.
- Grouping Data: If your dataset is extensive, consider grouping data to create subtotal rows. Excel allows users to group related data together, offering a more structured and organized view of the information.
- Conditional Formatting: To highlight specific aspects of your data, utilize Excel’s conditional formatting feature. This allows you to apply visual cues to the total row based on predefined conditions, making it easier to identify trends or outliers.
- Using PivotTables: For complex datasets with multiple dimensions, PivotTables provide a powerful way to create custom reports, including total rows and subtotals, enabling deeper insights into your data.
Conclusion
In this comprehensive Excel tutorial, we have explored two advanced methods to add a total row to your datasets, leveraging the power of Excel tables and the AutoSum feature. The ability to display cumulative values in each column enhances data analysis, making it easier to identify trends and patterns.
Adding total rows in Excel is a fundamental technique that every Excel user should master. By following the detailed steps outlined in this tutorial and customizing total rows to suit your specific data analysis needs, you can take your Excel skills to the next level and make well-informed decisions based on accurate insights.
So, the next time you embark on a data analysis journey with Excel, remember to incorporate total rows, and you’ll be well on your way to Excel mastery! Happy Excel-ing!