Integrating Excel data into PowerPoint is a great way to incorporate detailed information and analytics into your presentations. With a few simple steps, you can link or embed Excel charts, tables, and graphs directly into PowerPoint slides. This guide covers everything you need to know to insert Excel spreadsheets and selections into PowerPoint seamlessly.
Inserting Excel data allows you to easily update linked information and formatting across Office applications. By linking or embedding Excel ranges, cells, and charts, you can efficiently reuse your spreadsheet content in PowerPoint presentations.
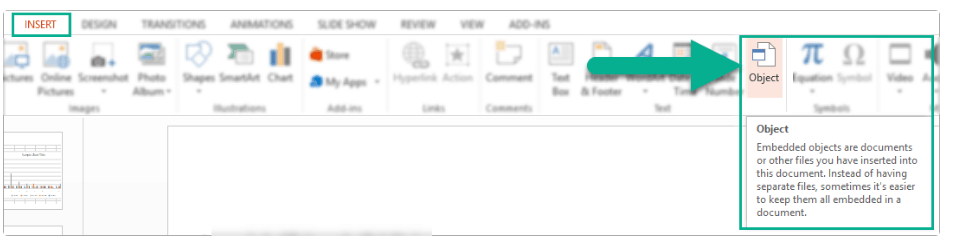
Methods to Insert Excel Data into PowerPoint
There are three main methods for bringing Excel data into PowerPoint slides:
Paste Link
This inserts the data as a live Excel object that stays linked to the original spreadsheet. Any changes made to the Excel file will automatically update in PowerPoint.
Paste Values
This pastes a static copy of the data into PowerPoint, breaking the link to Excel. The data can’t be edited after inserting.
Paste Picture
This pastes the Excel selection as an image in PowerPoint. You lose formatting capabilities but gain image editing options.
Inserting an Entire Excel Spreadsheet
To insert an entire spreadsheet as an editable Excel object:
- In PowerPoint, go to the Insert tab and Click on Object.
- Now from Object > Create from File.
- Browse to and select the Excel file.
- Check the Link to file box.
- Click OK.
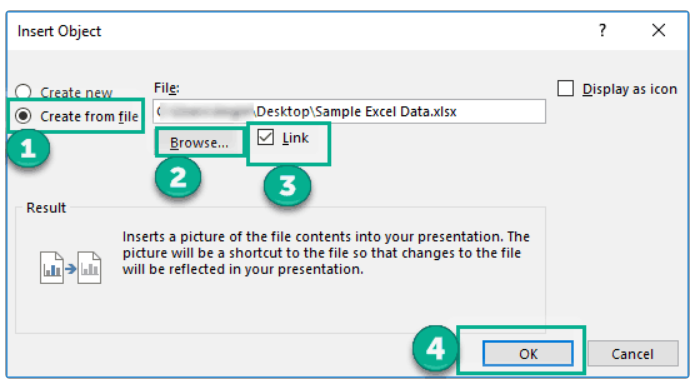
This embeds the spreadsheet as an object you can resize or double-click to edit in Excel later. Any changes made will update automatically.
Linking Partial Excel Data
Rather than inserting the entire spreadsheet, you may want to link only a certain range of cells or a chart.
To link part of an Excel file:
- In Excel, copy the range or chart you want to insert.

- In PowerPoint, paste the selection.

- Choose Paste Link and select Microsoft Excel Worksheet Object or Microsoft Excel Chart Object in the dialog box.
- Click OK.

Now this content will stay dynamically linked to the source Excel file.

Inserting Excel Data without Links
If you don’t need the live connection, you can embed or paste Excel data into PowerPoint without linking it:
- Copy and paste values only to remove all formulas and formatting.
- Copy and paste as a picture to insert a screenshot of the selection.
- Copy and paste using “Keep Source Formatting” to retain Excel formatting.
- Double-click a linked object and select “Break Link” to sever its connection to Excel.
These methods allow you to reuse Excel data without updates. The values, formatting, and visuals will remain static after inserting them.
Formatting Considerations
When inserting Excel data into PowerPoint, you can choose to retain source formatting from Excel or take on the PowerPoint theme formatting:
- To make the inserted content blend with your PowerPoint theme and slide design, paste using “Use Destination Theme” or format it after inserting.
- To retain all Excel formatting, such as colors, fonts, borders, paste with “Keep Source Formatting”.
Consider which option makes the Excel data integrate most seamlessly into your presentation.
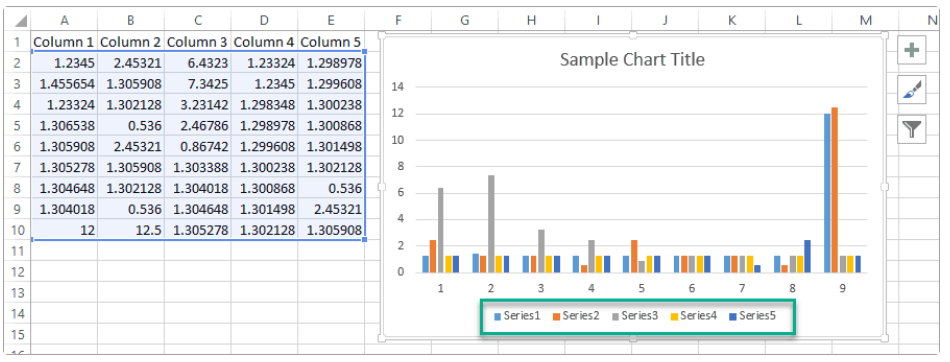
Modifying Excel Charts After Inserting
If you want to adjust components of the Excel chart within PowerPoint, right-click the inserted chart and choose Edit Data to open the Excel spreadsheet. From here you can:
- Change the data source and reselect cells.
- Switch row or column data used for the chart axes.
- Modify labels, legends, and other chart elements.
- Update colors, fills, and styles.
After editing, save the Excel file to see the changes applied in your PowerPoint slide.
Adjusting Sizes and Positioning
Once inserted into the slide, you can resize, rotate, or reposition an Excel object like any other PowerPoint element.
- Grab a corner sizing handle to make it bigger or smaller.
- Click and drag to move its position.
- Rotate the object by clicking the green circle above it and dragging.
Ensure data tables and charts are sized appropriately so audience members can clearly interpret the information.
Troubleshooting Excel Integration Issues
If links break or Excel data doesn’t import correctly, here are some things to check:
- Verify the source Excel file is not already open in another app like Excel. Close any open instances.
- For links, ensure the original spreadsheet is saved after making changes for updates to reflect in PowerPoint.
- Check that cell references and named ranges haven’t changed in the Excel workbook. Relink if necessary.
- Try copying and pasting values only to remove complex Excel formatting and formulas.
- If pasting large datasets, transition to Excel Tables to maintain cell references.
With these tips in mind, you can skillfully integrate Excel data into your PowerPoint presentations. Importing figures, values, and tables from Excel makes it easier to visualize key information from spreadsheets in your slides.
Conclusion
Integrating Excel data into your PowerPoint presentations opens up powerful possibilities for data visualization and analytics-driven storytelling. By linking live Excel ranges or embedding static copies, you can build visually compelling slides that leverage the detailed information in your spreadsheets. Just be mindful of retaining or removing links, formatting data appropriately, and modifying charts within PowerPoint as needed.
With a few simple copy and paste actions, you can insert exact spreadsheet selections or entire worksheets for reuse in your presentations. Whether you want to highlight key data points, illustrate trends in charts, or provide accessible tables, importing Excel data into PowerPoint is easy and efficient. Follow the tips outlined here to seamlessly blend Excel and PowerPoint together for informative, data-driven slides that will make your presentations more engaging and impactful for audiences.