Working with plain cell ranges in Excel has its limitations when managing tabular datasets. Without structured formatting, options become limited for manipulating, analyzing and sharing data intelligently.
Converting these plain ranges into dedicated Excel tables unlocks far more powerful functionality that solves the above limitations. Specifically, structured tables allow for easier sorting, filtering, dynamic updating, format retention, named referencing in formulas, and data reporting capabilities among other features.
But to tap into these capabilities first requires learning how to properly insert a table from your raw datasets. The basic steps for table creation work uniformly across all versions of Excel. So whether using the latest Office 365 or legacy desktop editions, you’ll be able to leverage the same improved dataset management features.
In this comprehensive tutorial, we will walk through the essential methods for inserting tables from scratch in Excel. By the end, you will become an expert in developing structured Excel tables that act as the foundation for simplifying your data analysis and management workflows. So let’s get started exploring how to tap into the power of tables!
Prepare Your Data Range
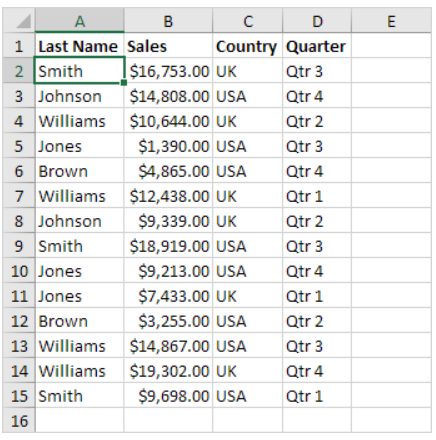
Before inserting an Excel table, enter your data into the worksheet. Organize this as a standard range of cells, including column headings in the first row.
As a best practice, make sure:
- There are no completely blank rows or columns within your data range. This can cause errors upon conversion.
- The top-left cell should begin your data range to capture headers.
- Encompass all contiguous rows and columns in the selection.
Once your dataset is ready, proceed to insert the structured table.
Select the Table Range
To define the table area, follow these steps:
- Click into the upper-left cell of your data range.
- Drag the cursor down and across to select the entire data set. This range should cover:
a) Column headers in the first row
b) All data rows below the headers
c) All contiguous columns needed
- Accurately encompassing the range is key so the table has room to grow dynamically.
Insert the Excel Table
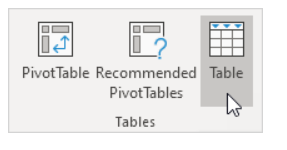
- With the target range selected, go to the Insert tab on Excel’s ribbon.
- In the Tables group, click the Table button.
- For Excel 2010+: The Quick Analysis tool appears once you select data. Use its Format as Table button instead.
Define Your Table
The Create Table dialog box appears where you can define table parameters:
- Ensure the range address matches the selected data.
- Check “My table has headers” if the first row has column names.
- Click OK to finalize table insertion.

Done! Your data instantly converts from a range to a structured table format.

Some Additional Tips and Tricks
Modify and Resize Your Table
Once inserted, leveraging tools under Table Design and Table Analyze makes managing, formatting, and expanding your table smooth.
- Alter Table Style and Dimensions
- Apply aesthetically pleasing styles, add total rows, turn filtering on/off, and more:
Table Style Options: Choose premade styles
Sizing Handles: Drag handles to change table size
Checkboxes: Toggle table functionality
Dynamically Add or Remove Data
Easily append rows and columns thanks to Excel tables’ flexibility:
- Insert Buttons (Table Design): Add blank rows above/below and columns left/right
- Delete Key: Deletes any rows, columns or cells
- Ctrl + Spacebar: Inserts new blank row when cursor in table
Remaining cells auto-adjust!
Leverage Table Functionality
With your data now in an Excel table, take advantage of native features that simplify working with datasets:
Sorting & Filtering
Quick column sorting and filtering via clickable header icons
Structured Referencing
Table and column names used in formulas for dynamic outputs
Slicers
Custom button-based filtering mechanisms
So if you want to seriously enhance your Excel data analysis capabilities, harness the power of tables! The additional tools versus plain ranges make workflows much more efficient.
Conclusion
After following this guide, you should now feel completely comfortable with how to insert and customize tables in Excel for robust datasets. The basic process works uniformly across all Excel versions.
Unlike standard ranges, structured tables expand your capabilities for sorting, filtering, referencing cells, applying formats, bringing in external data, and summarizing insights. Learning to leverage these native table features is key to streamlining your data analysis workflows.
With properly organized data now in tables, additional functionality opens up across Excel too for building more automated reporting pipelines. So if you take away anything here, remember that getting cozy with table creation sets the stage for more scalable workflows by solving the inherent limitations of plain cell ranges.