In the world of statistics, the p-value reigns supreme as a crucial measure of significance. Whether you’re a seasoned data analyst or a novice researcher, understanding how to find the p-value in Excel can be a game-changer in your analytical toolkit.
In this article, we’ll delve into the significance of the p-value, explore multiple hacks to understand how to find the p value in Excel, discuss its uses, weigh its pros and cons, and highlight key considerations for its effective utilization.
Understanding the Significance of P-Value:
The p-value is a statistical measure that helps assess the strength of evidence against a null hypothesis. In simpler terms, it quantifies the probability of obtaining results as extreme as the observed data under the assumption that the null hypothesis is true.
A low p-value indicates strong evidence against the null hypothesis, suggesting that the observed results are unlikely to occur by chance alone.
Multiple Hacks to Find P-Value in Excel:
-
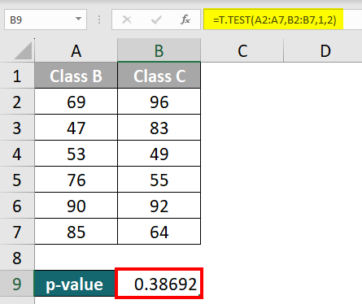
Excel Functions:
Excel offers several functions to calculate p-values for different statistical tests.
For example, the T.TEST function can be used for hypothesis testing involving sample means, while the CHISQ.TEST function is suitable for testing relationships between categorical variables using the chi-square test.
-
Data Analysis Toolpak:
Excel’s Data Analysis Toolpak is a powerful add-in that provides a wide range of statistical functions, including those for calculating p-values.
By enabling the Toolpak in Excel’s options, users gain access to functions such as ANOVA, F-Test, and Z-Test, simplifying the process of obtaining p-values for various analyses.
-
Manual Calculation:
While Excel offers built-in functions, understanding the underlying formulas can empower users to manually calculate p-values for custom analyses.
For instance, computing a t-statistic and using a t-distribution table can help derive p-values for hypothesis tests involving sample means.
Uses of P-Value:
-
Hypothesis Testing:
P-values play a central role in hypothesis testing, enabling researchers to determine whether observed differences or relationships in data are statistically significant.
-
Decision Making:
In fields like medicine, economics, and social sciences, p-values inform critical decisions regarding treatment efficacy, policy interventions, and market trends.
-
Comparative Analysis:
P-values facilitate comparisons between groups or conditions, aiding in the identification of meaningful differences or associations.
Pros and Cons of P-Value:
Pros:
- Provides a quantitative measure of statistical significance.
- Facilitates hypothesis testing and decision making.
- Offers a standardized approach for comparing results across studies or experiments.
Cons:
- Vulnerable to misinterpretation, especially when used in isolation without considering effect sizes or context.
- Susceptible to false positives, particularly in studies with small sample sizes or multiple comparisons.
- Does not provide information about the magnitude or practical importance of observed effects.
Things to Consider While Using P-Value:
-
Context Matters:
Always interpret p-values in conjunction with effect sizes, confidence intervals, and domain knowledge to gain a comprehensive understanding of the results.
-
Be Cautious with Multiple Testing:
Adjust p-values for multiple comparisons to mitigate the risk of inflated Type I errors (false positives).
-
Consider Sample Size:
Larger sample sizes tend to yield more reliable p-values, whereas small samples may produce unstable or misleading results.
-
Question Assumptions:
Assess the validity of underlying assumptions for statistical tests, as violations can compromise the accuracy of p-values.
Conclusion:
In conclusion, mastering the art of finding the p-value in Excel empowers analysts and researchers with a potent tool for statistical inference and decision making.
By understanding its significance, leveraging multiple hacks for computation, recognizing its uses, and navigating its pros and cons with careful consideration, users can harness the full potential of the p-value in their analytical endeavors.
So, next time you embark on a data analysis journey, remember the power of the p-value and its indispensable role in unraveling the mysteries of statistics.