In data analysis and statistics, determining the slope of a line allows you to quantify the relationship and correlation between two variables. The slope value provides a numerical representation of the steepness and direction of the linear trend between data points.
In Excel, finding slope is an essential skill for understanding your data and predicting future outcomes based on current trends. This comprehensive guide will teach you several easy methods to find and interpret slope values using Excel’s built-in tools and formulas.
What is Slope and Why Does it Matter?
The slope of a straight line measures its steepness and indicates if the line is rising or falling from left to right. Also referred to as the gradient, the slope is calculated as the vertical change divided by the horizontal change between two points on a line. In the linear equation y = mx + b, the slope is represented by m.
Slope is hugely helpful for analyzing data correlations. A positive slope means there is a direct relationship between the x and y variables – as x increases, y also increases. The higher the positive slope value, the steeper the uptrend line. A negative slope indicates an inverse correlation between the variables, with y decreasing as x increases.
The lower the negative slope, the steeper the downtrend. A slope of zero means a perfectly horizontal flat line with no correlation between the variables. By determining the slope of a linear regression trendline fitted to your data, you can measure the strength of correlation and the dynamics of change between data variables. Mastering slope in Excel provides powerful insights for future forecasts and predictive modeling.
Using the SLOPE Function
Excel’s SLOPE function calculates slope automatically from arrays of x- and y-values.
Syntax:
=SLOPE(known_y’s, known_x’s)
Where:
- known_y’s is the array of y-values
- known_x’s is the array of x-values
For example:
Here is a sample data set that we’re gonna be using for our coming examples:
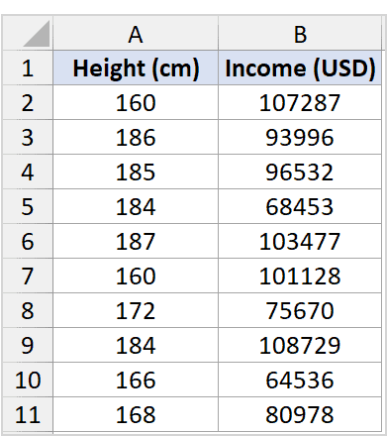
=SLOPE(B2:B11,A2:A11)
This returns the slope of the linear regression line for the x-values in A2:A11 and y-values in B2:B11.
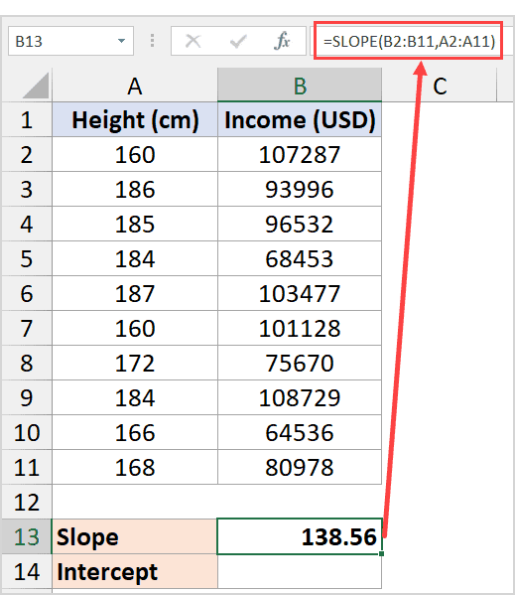
The SLOPE function is quick and straightforward for finding slope in Excel.
Using Charts to Find Slope
You can also determine slope visually from an Excel scatter chart.
To do this:
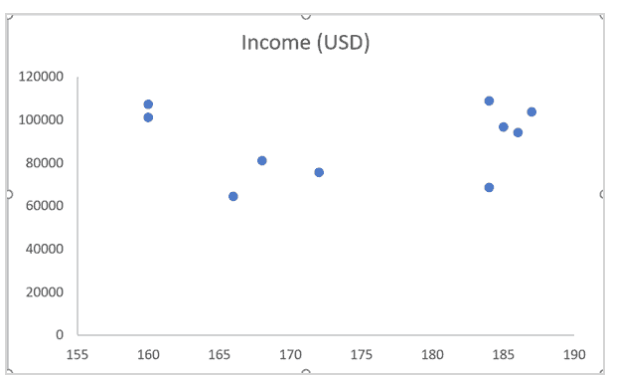
- Plot the x- and y-value data points of our sample data set in a scatter chart like this:
- Add a trendline.

- Right click the trendline and select “Format Trendline”.
- Check the box for “Display equation on chart”.

This will show the equation for the trendline on the chart, with the slope value clearly labeled.

Charts allow you to see the slope and relationship between variables.
Calculating Slope Manually
It’s also possible to calculate slope yourself using two data points:
Slope Formula:
m = (y2 – y1) / (x2 – x1)
Where:
- m is slope
- (x1, y1) are the coordinates of point 1
- (x2, y2) are the coordinates of point 2
For example:
Given points (2, 3) and (6, 5), the slope is:
m = (5 – 3) / (6 – 2)
m = 2/4
m = 0.5
While more time-consuming than Excel formulas, manually calculating slope helps you understand what the value represents.
Determining the Y-Intercept
To find the y-intercept (b) of a line along with slope, use the INTERCEPT function:
=INTERCEPT(known_y’s, known_x’s)

Or use the chart trendline equation or manual calculations with point coordinates.
The y-intercept indicates where the line crosses the y-axis.
Interpreting the Significance of Slope
The meaning of a slope value depends on the data, but some general insights apply:
- Slope = 0 means no linear relationship between x and y (a flat horizontal line).
- Positive slope indicates that y increases as x increases. Larger positive slopes signify steeper uptrends.
- Negative slopes mean y decreases as x increases. More negative slopes mean steeper downtrends.
- Slopes near -1 or +1 indicate a very strong correlation between the variables.
Understanding slope in context is crucial for proper data analysis and modeling.
Excel Limitations for Non-Linear Data
Note that the SLOPE and trendline methods calculate a linear regression slope. This may not fit non-linear data well.
For non-linear data, consider adding a polynomial or logarithmic trendline to inspect curve slope changes. Or use the LINEST function for linear or non-linear regression statistics.
In Summary
Determining slope in Excel provides a simple way to quantify the steepness and direction of the relationship between two data variables. The built-in Excel tools, formulas, charts, and manual slope calculations discussed here make it easy to find and interpret slope values from your data. Mastering slope allows a much deeper understanding of correlations and trends for improved data analysis and modeling.