In the vast and ever-evolving field of data analysis, there’s a hidden challenge: outliers. These are like the oddballs in your data that can make your analysis go haywire. But fear not! We’re here to guide you through a comprehensive step-by-step process to tackle this issue using Excel. Our journey together will equip you with the skills and confidence to navigate through your data with precision.
From the very basics, we’ll walk you through the process of identifying and handling outliers. So, whether you’re a seasoned data analyst or just dipping your toes into the world of data, this comprehensive guide will be your trusty companion. By the end of this blog post, you’ll possess the skills to deftly handle outliers and take your data analysis to new heights.
Let’s embark on this enlightening adventure together, as we unravel the mysteries of identifying and managing outliers in Excel, opening up a world of data-driven possibilities for your future endeavors.
Understanding Outliers
What are Outliers?
Outliers, within the realm of data analytics, emerge as extraordinary data points that deviate significantly from the established pattern. They are the anomalies that beckon further investigation, for they possess the ability to alter statistical outcomes and potentially sway analytical conclusions.
Why are Outliers Important?
The significance of outliers lies in their ability to influence and distort analysis results. They have the potential to skew statistical measures, thereby leading to incorrect interpretations and decisions. Identifying outliers is pivotal to ensure the integrity and accuracy of the analytical process.
Identifying Outliers in Excel Using Manual Sorting
Initial Data Assessment
With smaller datasets, a preliminary approach to identifying outliers involves a manual sorting process. This method entails sorting the data in both ascending and descending orders to scrutinize the top values for potential outliers.
Manual Sorting in Ascending Order
To initiate the manual sorting process:
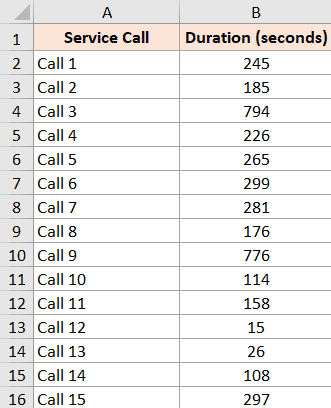
- Select the Column Header of the desired data column (e.g., cell B1 in this example).
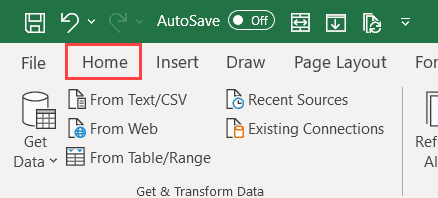
- Click on the Home tab.
- Within the Editing section, find and select the Sort & Filter symbol.

- Choose the “Custom Sort” option.

- In the Sort dialog box, select the target data column under ‘Sort by’ and opt for ‘Smallest to Largest’ in the ‘Order’ drop-down.
- Confirm your selection by clicking “Ok.”

- The described procedure will arrange the call duration column in descending order, positioning the entries with the greatest values at the forefront. Subsequently, you can conduct a thorough manual examination of the dataset to identify the presence of any potential outliers.

Using Formulas to Detect Outliers
Calculating Z-Scores
Excel offers a powerful approach to outlier detection through statistical formulas. The Z-Score, a standardization of data points, quantifies their deviation from the mean. By calculating the Z-Score for each data point, those lying outside a specific range can be earmarked as potential outliers.
Applying the Modified Z-Score Method
Building upon the conventional Z-Score, the Modified Z-Score method enhances outlier detection. By incorporating the median and median absolute deviation, this technique adapts to data peculiarities, yielding a more nuanced outlier identification process.
Creating Visual Representations
Constructing Box Plots
Visual representations offer an intuitive means of detecting outliers. Box plots, also known as box-and-whisker plots, display data distribution and highlight potential outliers beyond the “whiskers.”
Developing Scatter Plots
Scatter plots provide an alternative visual perspective. Outliers, as data points deviating substantially from the overall pattern, become readily apparent when plotted on a scatter graph.
Employing Advanced Techniques for Outlier Detection
Leveraging the Interquartile Range (IQR)
The Interquartile Range, a robust measure of data spread, introduces a potent approach to outlier detection. Data points lying outside the IQR range are flagged as potential outliers, contributing to a comprehensive outlier identification strategy.
The Significance of Data Cleaning
Before embarking on outlier detection, data cleaning assumes paramount importance. Ensuring data accuracy and consistency lays the foundation for reliable outlier identification and subsequent analysis.
Conclusion
The journey to unearth outliers in Excel is a multifaceted exploration. By meticulously embracing methods such as manual sorting, statistical formulas, and visual representations, you equip yourself to navigate the intricate data landscape. The identification and management of outliers not only ensure analytical accuracy but also empower you to make informed decisions based on unclouded insights.