Whether you’re a seasoned analyst or just starting your journey into the world of spreadsheets, understanding how to find the mode in Excel can be incredibly beneficial.
The mode, often referred to as the most frequently occurring value in a dataset, is a critical statistic for various applications such as business, statistics, and research. In this comprehensive guide, we will walk you through the steps to find the mode in Excel, covering both simple and complex scenarios. By the end of this article, you will be equipped with the knowledge and skills to handle mode calculations effortlessly.
What is Mode in Excel?
The mode in Excel represents the value that appears most frequently in a dataset. It’s a fundamental statistical measure that provides insights into the central tendency of your data. Knowing the mode is particularly valuable when dealing with large datasets, as it helps identify the most prevalent values.
Simple Mode Calculation
To find the mode in Excel, follow these steps:
Organize Your Data: Start by ensuring your data is well-organized in a column or row within an Excel worksheet.
Select a Cell: Click on an empty cell where you want to display the mode result.
Use the MODE Function: In the selected cell, type the following formula:
=MODE.MULT(range)
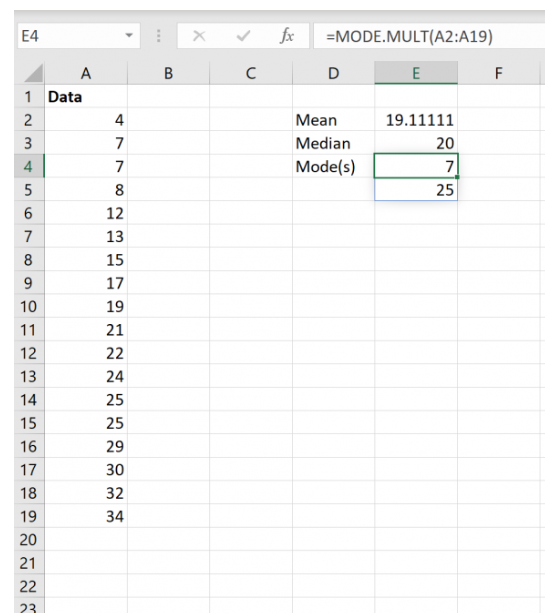
Replace ‘range’ with the actual range of cells that contains your data. For example, if your data is in cells A1 to A10, the formula should look like this:
=MODE.MULT(A2:A19)
Press Enter: After typing the formula, press Enter. Excel will calculate and display the mode value.
Handling Multiple Modes
In some cases, a dataset may have more than one mode, making it multimodal. Excel can handle this scenario as well. When you use the MODE.SNGL function as described above, it returns the lowest mode value if there are multiple modes. If you prefer to see all modes, you can use the MODE.MULT function instead.
Using Excel Functions
Excel provides several functions for finding the mode, each tailored to different scenarios:
- MODE.SNGL: Finds the mode in a dataset with a single mode. Use this when you expect only one mode value.
- MODE.MULT: Identifies all modes in a dataset, suitable for multimodal data.
Mode for Categorical Data
So far, we’ve discussed finding the mode for numerical data. However, Excel can also help you find the mode for categorical data. Simply apply the same MODE.SNGL or MODE.MULT functions to the column or range containing your categories.
Advanced Tips for Excel Mode Analysis
Now that you’ve mastered the basics of finding the mode in Excel, let’s delve deeper into some advanced tips and tricks:
1. Binning Data for Better Understanding
When dealing with large datasets, it can be beneficial to group similar values into bins. This simplifies the analysis and helps identify modes within specific ranges. Excel’s histogram feature can assist you in creating these bins and visualizing the distribution of your data.
2. Detecting Outliers
Outliers can significantly impact mode calculation, especially in large datasets. Consider using Excel’s outlier detection techniques to identify and handle these values appropriately before finding the mode.
3. Mode for Date and Time Data
If you’re working with date and time data, Excel’s mode functions can still be used effectively. Just remember to format your cells correctly to ensure accurate results. You can also extract specific components like months or days to find modes within those intervals.
4. Combining MODE with Other Functions
Excel’s real power lies in its ability to combine functions. You can use the mode in conjunction with other Excel functions like AVERAGE, MEDIAN, or SUM to gain deeper insights into your data.
5. Visualizing Modes
Consider creating charts or graphs to visualize the mode(s) in your dataset. This can make it easier for stakeholders to grasp the significance of the mode within the context of your analysis.
Conclusion
In the world of data analysis, Excel is a true powerhouse, and knowing how to find the mode in Excel is a valuable skill. Whether you’re analyzing sales figures, survey responses, or any other dataset, the mode can provide crucial insights into your data’s central tendency.
Remember that Excel offers both single-mode and multiple-mode functions, allowing you to adapt to various data scenarios. So, the next time you’re faced with a dataset, harness the power of Excel to find the mode efficiently.
Now that you’ve not only mastered the art of finding the mode in Excel but also gained valuable insights into advanced techniques, you can confidently explore other statistical measures and unlock even more insights from your data.