Calculating standard deviation in Excel is an essential skill for anyone dealing with data analysis, statistics, or even everyday spreadsheet tasks. Standard deviation helps us understand the dispersion or variability within a dataset, providing valuable insights into the data’s reliability and consistency.
Whether you’re a student, a data analyst, or a business professional, mastering this statistical measure in Excel is a fundamental step towards making more informed decisions and drawing meaningful conclusions from your data. In this blog post, we’ll walk you through the process of calculating standard deviation in Excel, demystifying the formula and functions to help you become a more proficient data handler.
Understanding Standard Deviation
What is Standard Deviation?
Standard deviation is a statistical measure that quantifies the amount of variation or dispersion in a dataset. In simpler terms, it helps you understand how spread out the values in your data are. A low standard deviation indicates that the data points are close to the mean, while a high standard deviation suggests that the data points are more scattered.
Why is Standard Deviation Important?
Standard deviation is a crucial tool in data analysis for several reasons:
- Measure of Uncertainty: It helps assess the degree of uncertainty or risk associated with a set of data.
- Comparison: It allows you to compare the variability of different datasets, making it easier to draw meaningful conclusions.
- Quality Control: In business and manufacturing, standard deviation is used to monitor the consistency and quality of products or processes.
Now that we’ve grasped the basics, let’s move on to the practical aspects of calculating standard deviation in Excel.
Calculating Standard Deviation in Excel
Excel provides several functions to calculate standard deviation, depending on your data and requirements. Here, we’ll cover the most commonly used method:
Using STDEV Function
- Open Excel: Launch Microsoft Excel and open the spreadsheet containing your data.
- Select a Cell: Click on a cell where you want the standard deviation to appear.
- Enter the Formula: Type “=STDEV(” in the selected cell.
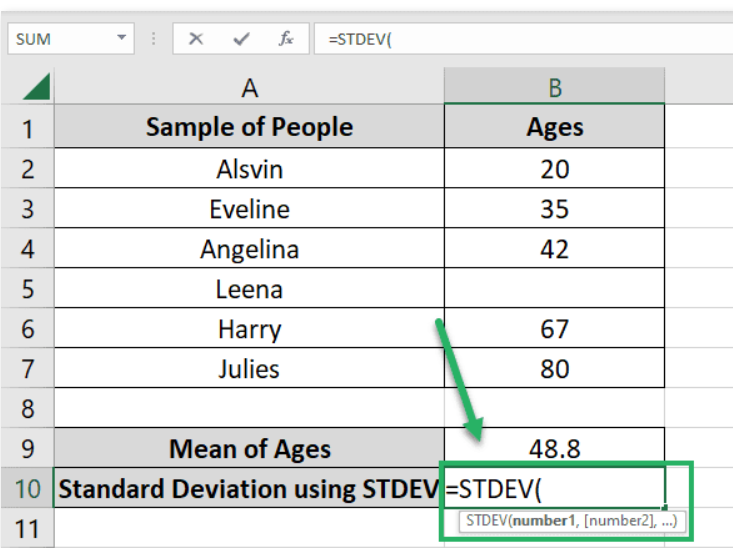
- Select Data Range: Highlight the range of data for which you want to calculate the standard deviation.
- Close the Formula: After selecting the data range, close the formula with a closing parenthesis (“)”).

- Press Enter: Hit the Enter key, and Excel will calculate and display the standard deviation.

Interpreting Standard Deviation Results
Understanding the output of standard deviation is crucial for making informed decisions based on your data. A few key points to keep in mind:
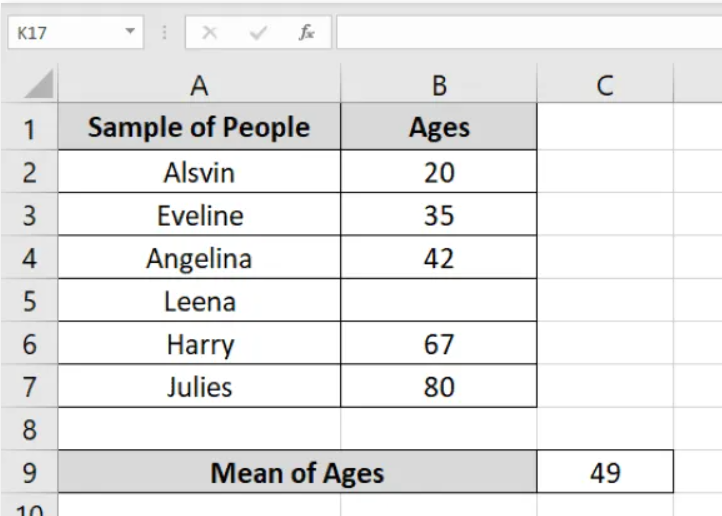
- Mean (Average): The mean value of your data is a reference point. Data points close to the mean have lower deviations, while those farther away have higher deviations.
- Standard Deviation Value: The actual standard deviation value tells you how spread out your data is. A smaller value means less variability, while a larger value indicates greater variability.
- Application: Use standard deviation to assess risk, make predictions, and identify trends in your data.
Practical Applications of Standard Deviation
Standard deviation finds applications in various fields:
Finance
In finance, standard deviation is used to measure the volatility of investment returns. It helps investors assess the risk associated with different investment options.
Quality Control
Manufacturers use standard deviation to monitor the consistency and quality of their products. Lower standard deviation indicates that products meet strict quality standards.
Scientific Research
Researchers use standard deviation to analyze experimental data, ensuring the reliability of their findings.
Education
Educators and administrators use standard deviation to evaluate students’ performance and assess the effectiveness of teaching methods.
Conclusion
In conclusion, mastering the calculation of standard deviation in Excel is a valuable skill that can significantly enhance your data analysis capabilities. By understanding and applying this statistical measure, you gain the ability to quantify the variability within your datasets, making it easier to identify patterns, trends, and outliers.
Whether you’re analyzing financial data, conducting scientific research, or simply managing your household budget, Excel’s standard deviation functions and formulas are powerful tools at your disposal. We hope this guide has provided you with the knowledge and confidence to harness the full potential of Excel for your data analysis needs.
As you continue to explore and apply these techniques, you’ll find that Excel becomes an indispensable partner in your quest for deeper insights and more informed decision-making.