In today’s data-driven world, mastering Excel is no longer just a skill—it’s a necessity. Whether you’re a business professional, a student, or simply someone looking to organize and analyze data, Excel has become an indispensable tool.
One of the key functionalities that Excel offers is the ability to calculate tenure, which is particularly useful for HR departments, managers, and analysts to understand employee or project durations. In this comprehensive guide, we’ll walk you through the process of calculating tenure in Excel using the DATEDIF function, empowering you with the knowledge to efficiently manage and analyze your data.
Understanding Tenure and Its Significance
Before delving into the technical aspects of calculating tenure in Excel, it’s important to understand what tenure is and why it matters. Tenure refers to the length of time an individual has held a particular position, role, or job within an organization. It plays a crucial role in human resources management, helping organizations gauge employee loyalty, track career progression, and make informed decisions about promotions, raises, and even terminations.
Using the DATEDIF Function for Tenure Calculation
To demonstrate the step-by-step methods of calculating tenure, we will use the following dataset. In this dataset, we have provided the Joining Date and Leaving Date of several employees. Our goal is to calculate their tenure using Excel’s DATEDIF function.

Applying the DATEDIF Function
Calculating tenure in years and months is conveniently achieved using the DATEDIF function in Excel. Follow these steps to calculate tenure using DATEDIF:
- Begin by selecting an empty cell where you want the tenure result to appear, for example, E5.
- Enter the following formula in the selected cell:
=DATEDIF(C5, D5, “y”) & ” Years ” & DATEDIF(C5, D5, “ym”) & ” Months ”
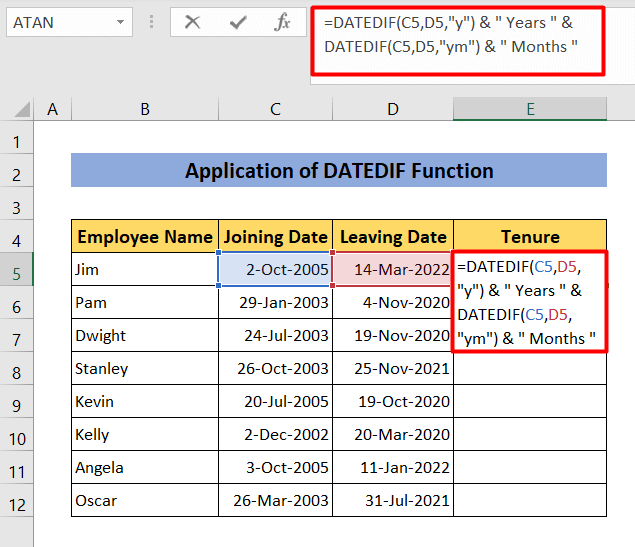
Here, C5 represents the joining date, and D5 represents the leaving date.
Formula Breakdown:
DATEDIF(C5, D5, “y”) calculates the number of years between the leaving date (D5) and the joining date (C5).
DATEDIF(C5, D5, “ym”) calculates the number of months as the fraction of years.
- Press Enter to get the desired result for the employee’s tenure in the selected cell, for instance, E5.
- To apply this formula to all relevant cells, drag the bottom right corner of the cell (E5) down to E12 while holding the left mouse button.
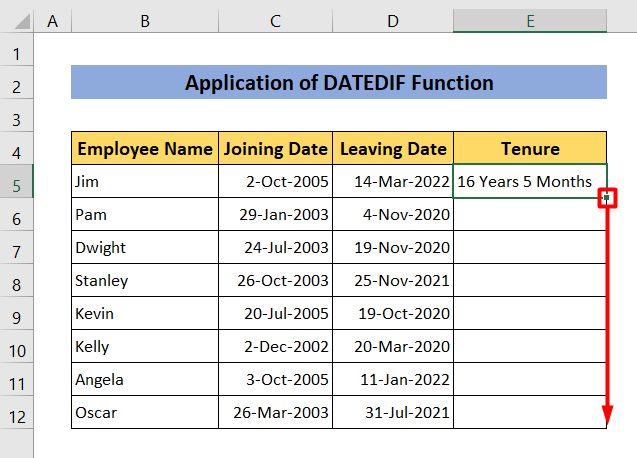
- This action will populate the calculated tenure values for all the provided dates.
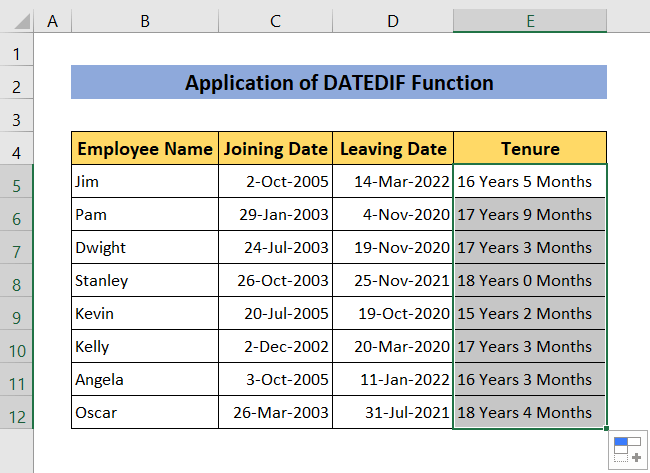
By following these steps, you can accurately calculate and visualize the tenure of employees using the DATEDIF function in Excel. This method offers a clear and efficient way to understand employee durations, enabling better decision-making within your organization.
Tips for Accurate Tenure Calculation
- Account for Gaps: Remember to consider any employment gaps when calculating tenure to ensure accurate results, especially for rehired employees.
- Part-Time Work: Adjust your calculations to accommodate both full-time and part-time employees, providing a comprehensive view of tenure.
- Future Dates: For ongoing employees, use the current date as the end date to capture their tenure up to the present moment.
The Importance of Accurate Tenure Calculation
Accurate tenure calculation goes beyond mere numbers. It’s a fundamental tool that organizations can use to gain insights into their workforce dynamics, employee retention rates, and career progression trends. By implementing precise tenure calculations, HR departments and management teams can make well-informed decisions that positively impact employee morale and organizational success.
Visualizing Tenure Data for Informed Insights
After calculating tenure using the DATEDIF function, the next step involves visualizing the data to glean meaningful insights. Excel offers a variety of visualization tools, including bar charts, line graphs, and scatter plots, to help you understand tenure trends more intuitively. These visual representations can assist in identifying patterns, spotting anomalies, and making data-driven decisions.
Tailoring Tenure Analysis to Your Organization’s Needs
Every organization is unique, and so are its requirements for tenure analysis. Excel’s flexibility allows you to customize your calculations to match your organization’s specific needs. Whether you’re focusing on a specific department, employee type, or project team, Excel’s functions can be adapted to provide you with the tenure insights that matter most to your organization.
Conclusion
Calculating tenure in Excel is a powerful tool that can provide valuable insights into workforce dynamics, employee retention, and career progression. By utilizing the DATEDIF function and following the steps outlined in this guide, you can accurately calculate tenure in both years and months. Remember, tenure isn’t just a number; it’s a strategic asset that organizations can leverage to make informed decisions and create a thriving work environment.
Empower yourself and your organization with the ability to analyze tenure data effectively. By mastering the techniques discussed in this guide, you’re equipping yourself with the skills needed to extract actionable insights from your data. Take advantage of Excel’s capabilities, explore the nuances of your workforce’s tenure, and pave the way for smarter, more informed decisions.