Probability is an important concept in statistics and data analysis that tells us how likely an event is to occur. Being able to calculate probabilities in Excel can be extremely useful for making forecasts, simulating events, and analyzing data. In this blog post, we’ll explain the basics of probability and show you step-by-step how to calculate probabilities using Excel’s built-in functions.
Whether you’re a student looking to solve probability problems or a business analyst wanting to forecast results, learning how to leverage Excel’s probability tools can take your data skills to the next level. Read on to learn how to use the PROB function to find probabilities and make better data-driven decisions.
Understanding Probability: A Primer
Probability is the measure of the likelihood that an event will occur. In simpler terms, it’s a way of quantifying uncertainty. As you delve into the realm of data analysis, understanding probability and learning how to calculate it becomes pretty fundamental.
Probability Basics
- Event: An outcome or a set of outcomes in an experiment.
- Sample Space: The collection of all possible outcomes in an experiment.
- Probability Range: A scale from 0 to 1, where 0 indicates impossibility, 1 indicates certainty, and values in between represent degrees of likelihood.
Leveraging Excel for Probability Calculation
Introducing the PROB Function
Excel simplifies the intricate process of calculating probability through its PROB function. This statistical powerhouse allows users to determine the likelihood of values falling within specified limits. It enables users to analyze data distribution and make informed predictions, making it an invaluable asset for statisticians, analysts, and decision-makers. The syntax is as follows:
=PROB(x_range, prob_range, [lower_limit], [upper_limit])
Breaking it down:
- x_range: Numeric values representing different events.
- prob_range: Probabilities corresponding to values in the x_range (must sum up to 1 or 100%).
- lower_limit (optional): The lower limit value for the desired event’s probability.
- upper_limit (optional): The upper limit value; if omitted, the function returns the probability associated with the lower_limit.
Applications in Data Analysis
Risk Assessment and Management
In the realm of finance, the PROB function proves invaluable for risk assessment. By analyzing historical data, financial analysts can use PROB to calculate the likelihood of specific outcomes, aiding in strategic decision-making and risk management.
Quality Control in Manufacturing
For industries focused on quality control, PROB is a game-changer. By applying the function to production data, manufacturers can predict the probability of defects or deviations, allowing for proactive measures to maintain product quality.
Marketing Strategy Optimization
Marketers, too, can harness the power of PROB. Analyzing customer behavior and purchase patterns through this function enables the creation of targeted campaigns, ensuring a higher probability of engagement and conversion.
Practical Applications: Examples
Example 1: Probability of Ticket Sales
Let’s apply the PROB function to determine the probability of ticket sales falling between 40 and 90.
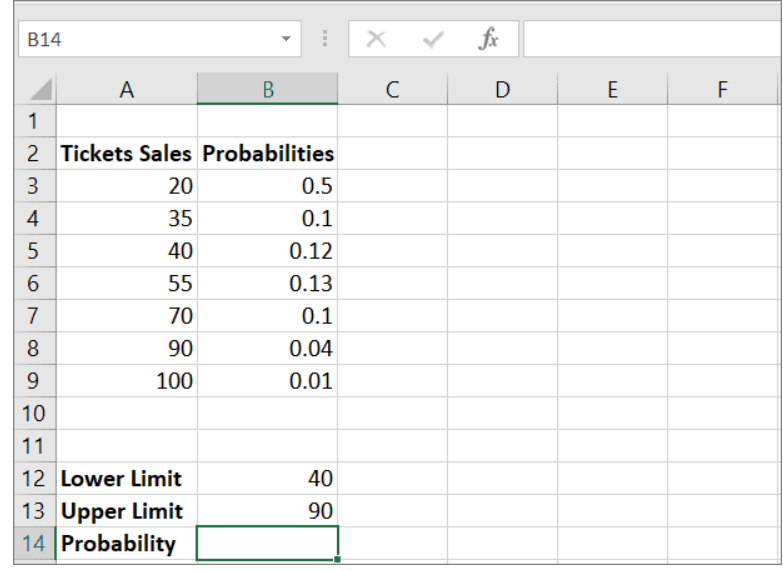
Data Preparation:
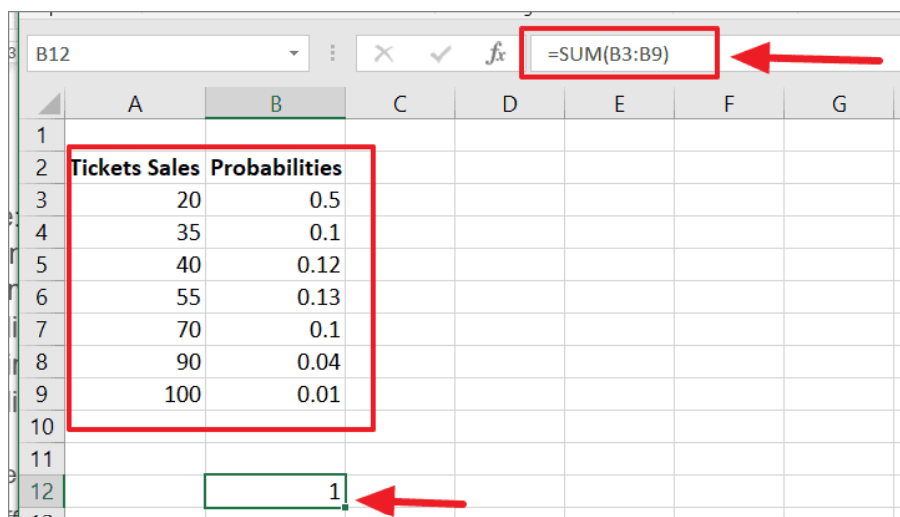
- Enter numerical values (ticket sales) and associated probabilities.
- Ensure the sum of all probabilities equals 1 (or 100%).
PROB Function Usage:
- Apply the formula =PROB(A3:A9, B3:B9, B12, B13) in Excel.

- Here, A3:A9 is the range of events, B3:B9 is the corresponding probabilities, B12 is the lower limit, and B13 is the upper limit.
Result Formatting:
Format the result as a percentage to obtain the probability value.

Example 2: Dice Probabilities
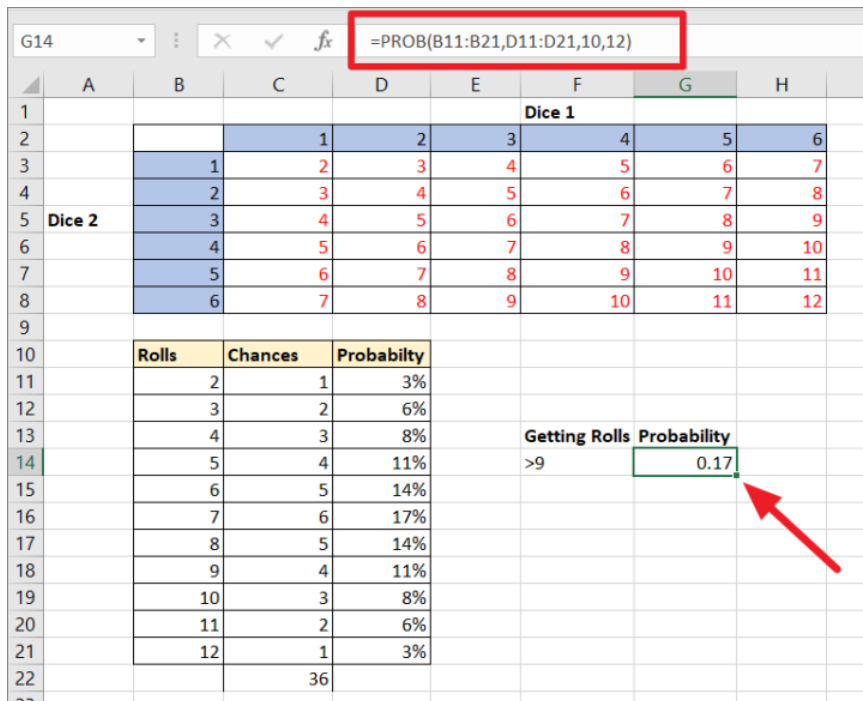
Now, let’s elevate the complexity by exploring the probability of rolling two dice.
Table Creation:
Establish a table with individual roll values and their chances.

COUNTIF Function Usage:
Count the number of chances for each roll using the formula =COUNTIF($C$3:$H$8, B11).

Drag down the formula to apply it to the rest of the cells

Individual Probabilities:
Use the formula =C11/36 to find individual probabilities for each roll.

Just like above, you’ll have to drag down the formula to apply on the rest of the cells:

PROB Function Application:
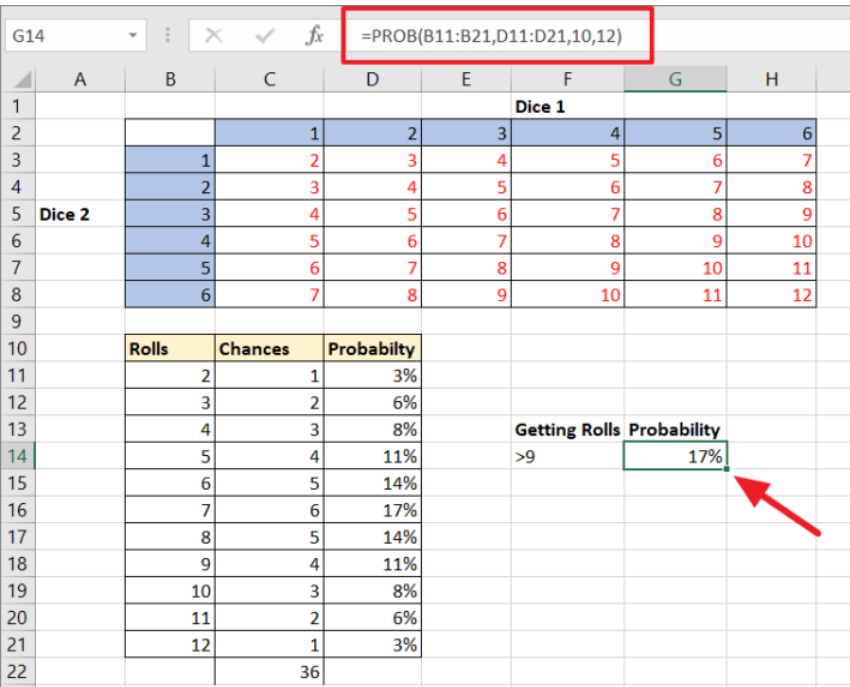
Utilize =PROB(B11:B21, D11:D21, 10, 12) to find the probability of rolls higher than 9.
Now convert it to percentage for better illustration and you’ll have your probability:
Tips for Optimal Use
1. Data Cleaning
Before applying the PROB function, meticulous data cleaning is crucial. Ensure your dataset is free from outliers and inaccuracies to obtain accurate probability calculations.
2. Understand Your Data Distribution
A nuanced understanding of your data distribution is key. PROB is most effective when applied to datasets with well-defined patterns, enhancing the reliability of your predictions.
3. Utilize Conditional Formatting
To visually interpret the results of your PROB calculations, leverage conditional formatting. This enhances the clarity of your data visualization and aids in the effective communication of insights.
In Conclusion
In conclusion, mastering probability calculation in Excel is not only a valuable skill but also an empowering tool for making informed decisions. This comprehensive guide has equipped you with the knowledge and practical applications of the PROB function, ensuring you can confidently navigate through diverse scenarios.
Whether analyzing ticket sales, exploring dice probabilities, or engaging in real-world situations, Excel’s capabilities combined with your newfound understanding of probability make you adept at deriving meaningful insights. Embrace the power of data-driven decision-making and elevate your proficiency in Excel, as you venture into a world where probabilities are not just numbers but gateways to strategic choices.