Statistical analysis plays a crucial role in extracting valuable insights from data. One such essential measure is the Mean Absolute Deviation (MAD), which helps in assessing the dispersion or spread of data points around the mean value of a dataset.
Unlike other measures, MAD considers the absolute values, thereby disregarding the direction of deviation from the mean. In this comprehensive guide, we will delve into the concept of Mean Absolute Deviation, understand its interpretation, explore the formula for calculating MAD, and demonstrate how to apply it in Excel.
Understanding the Concept of Mean Absolute Deviation
Mean Absolute Deviation (MAD) is a significant statistical measure that reveals how scattered or dispersed the data points are from the mean value. It provides valuable information about the variability of the dataset.
A lower MAD indicates that the data points are tightly clustered around the mean, suggesting higher consistency, while a higher MAD signifies a greater spread or variation from the mean, indicating more diverse data.
Interpreting MAD – Clustering and Dispersion
Mean Absolute Deviation is a versatile measure that aids in understanding both the clustering and dispersion of data. While measures of central tendency, such as the mean, provide valuable insights into where data are centered, measures of dispersion, like MAD, offer a deeper understanding of how data are spread.
MAD’s reliance on absolute differences, rather than squared differences, makes it less susceptible to the influence of outliers when compared to the standard deviation. Therefore, MAD is often preferred when you want to avoid the amplification of outlier effects.
Illustrating with an Example
To grasp the concept of MAD better, consider the following example with two datasets:
| Dataset #1 | Dataset #2 |
|---|---|
| 13 | 5 |
| 14 | 10 |
| 15 | 15 |
| 16 | 20 |
| 17 | 25 |
Both datasets have an average value of 15, but they represent entirely different data patterns. Dataset #1 exhibits a tight clustering around the mean, while Dataset #2 shows a broader dispersion from the mean.
The formula for Calculating Mean Absolute Deviation (MAD)
Calculating MAD involves a few straightforward steps:
- Find the mean of the dataset.
- Determine the absolute difference between each data point and the mean.
- Calculate the average of these absolute differences.
Applying the MAD Formula
Applying the MAD formula to the datasets above, we get the following results:
Dataset #1 MAD: 1.2
Dataset #2 MAD: 6
Despite both datasets having the same mean, the second dataset’s MAD is six times larger than the first, indicating greater dispersion.
Calculating MAD in Excel – Utilizing the AVEDEV() Function
To streamline the MAD calculation in Excel, you can leverage the built-in AVEDEV() function. This function efficiently handles numbers or ranges of numbers and provides the mean absolute deviation.
Syntax for AVEDEV() Function:
AVEDEV(number1, [number2], …)
The function takes one or more numbers as arguments. For manual entry, you can provide up to 255 values. However, using a range of values without restrictions is more practical.
Step-by-Step Guide for Calculating MAD in Excel
Let’s explore a step-by-step guide to calculate MAD using Excel’s AVEDEV() function:
- Organize your dataset in Excel, preferably in a column.

- Locate an empty cell where you want the MAD result to appear.
- Enter the formula AVEDEV() in the cell, followed by the range of data to analyze (e.g., B2:B11).
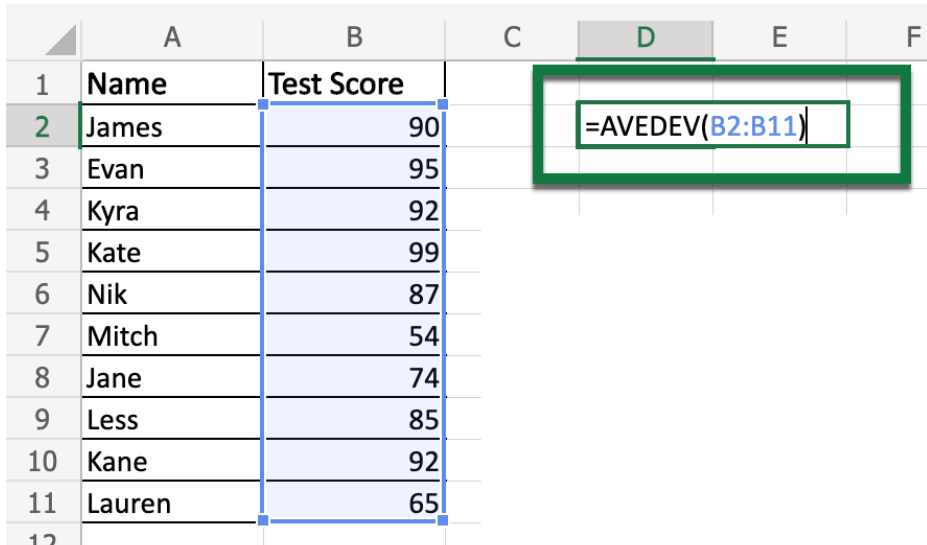
- Press Enter to obtain the MAD value.

Analyzing the MAD Result
Once you calculate the MAD using the AVEDEV() function, you will get a numeric value representing the mean absolute deviation of the dataset.
Advantages of Mean Absolute Deviation
MAD offers several advantages over other dispersion measures like the standard deviation:
- Less Susceptible to Outliers: Unlike the standard deviation, MAD is less influenced by outliers since it uses absolute differences, not squared differences. This property makes MAD a preferred choice when outlier amplification is undesirable.
Conclusion
In conclusion, this comprehensive guide explored the concept of Mean Absolute Deviation (MAD) and its significance in assessing the dispersion of data from the mean. We provided an illustrative example to grasp the concept better and offered a step-by-step guide to calculate MAD in Excel using the AVEDEV() function.
Additionally, we highlighted the advantages of MAD, particularly its resistance to outliers compared to the standard deviation. Incorporating MAD in your data analysis can enhance your understanding of data dispersion and lead to more informed decision-making. So, utilize the power of MAD in Excel to gain deeper insights from your datasets and make well-informed data-driven decisions.