Navigating the world of finance can often feel like deciphering a complex puzzle, with various tools and metrics contributing to the bigger picture. One such metric is beta, a fundamental concept in investment analysis that helps assess an asset’s volatility in relation to the overall market.
Whether you possess extensive experience in investing or are taking your initial steps in the financial domain, acquiring the knowledge of computing beta in Excel proves to be an indispensable skill. This comprehensive guide will walk you through the ins and outs of beta – from its significance and interpretation to a step-by-step tutorial on computing it using Excel.
By the time you’ve finished reading, you’ll be well-equipped to unravel the mysteries of beta and make more informed investment decisions. So, let’s dive into the world of numbers and discover how to unlock valuable insights with Excel’s analytical power.
Understanding Beta (β)
Beta (β) is a metric that measures the volatility, or systematic risk, of a stock’s returns compared to the market’s overall returns. In other words, it quantifies how much a stock’s price tends to move in relation to market fluctuations. Let’s break down the key interpretations of β:
- β = 1: This indicates that the stock’s price movements closely mirror the market’s fluctuations. It’s as volatile/risky as the market itself.
- β > 1: A value greater than 1 signifies that the stock’s price movements are more volatile than the market’s. The stock tends to experience stronger momentum—both upward and downward—than the benchmark. Including such a stock in a portfolio increases its overall risk. For instance, a β of 2 implies the stock’s price could rise or decline twice as fast as the broader market.
- β < 1: Conversely, a β value less than 1 implies the stock’s price movements are less volatile than the market’s. The stock’s price tends to fluctuate with less intensity compared to the benchmark. Adding this stock to a portfolio reduces its overall risk.
- β = 0: A β value of 0 indicates that the stock’s price movements are not correlated with the market’s fluctuations.
- β < 0: Finally, a negative β indicates an inverse relationship between the stock’s price movements and the market’s fluctuations.
Calculating Beta in Excel: Three Approaches
Method 1: Variance/Covariance Approach
The first method involves calculating Beta through variance and covariance analysis. Here’s a step-by-step breakdown:
- Download historical stock prices and benchmark index data for the desired period.
- Arrange the data with the “Date” column sorted from oldest to newest.
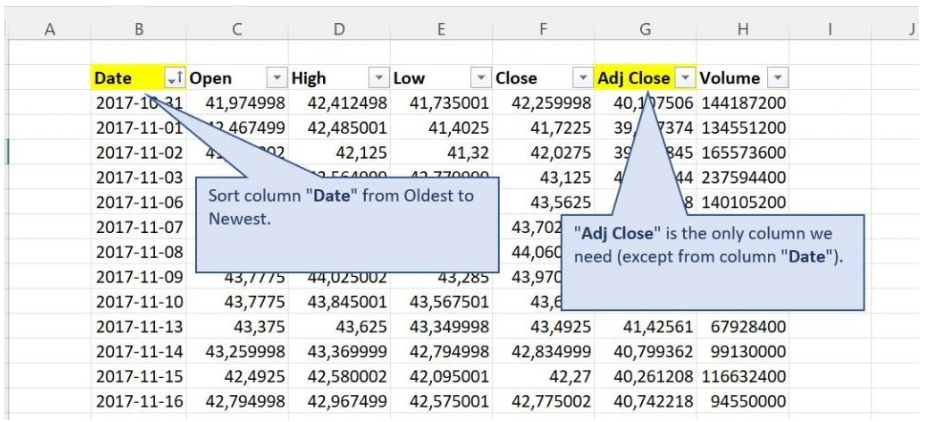
- Focus on the “Adj Close” column for both the stock and the index.
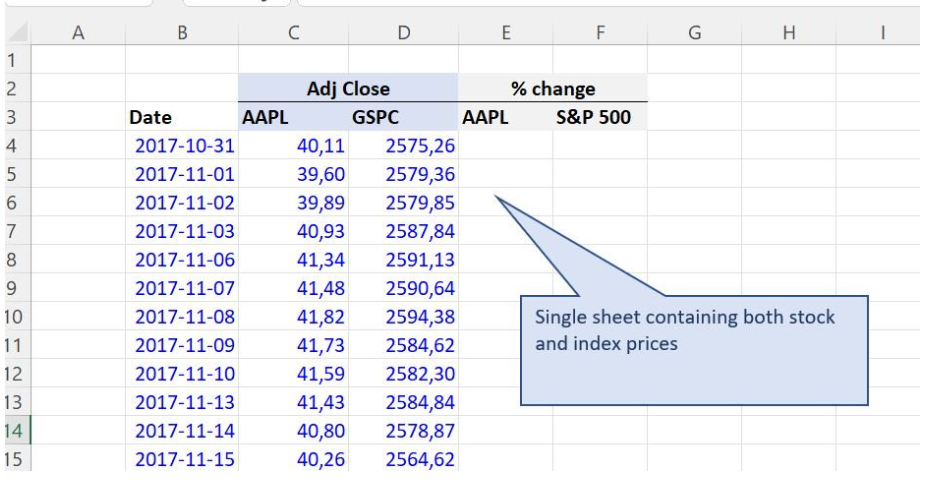
- Calculate the Variance of the benchmark using Excel’s VAR.P function.

- Compute the Covariance between stock price returns and benchmark price returns using Excel’s COVARIANCE.P function.

- Divide the Covariance by the Variance to obtain the Beta value.

Method 2: SLOPE Function Approach
The SLOPE function method employs linear regression to determine Beta:
- Download and organize the historical data.
- Compute the slope (Beta) using Excel’s SLOPE function.
- Select the stock price returns as the known_y’s in the function.
- The slope reflects the rate of change along the regression line, representing the Beta value.

Method 3: Data Regression Approach
The third method harnesses Excel’s Regression calculator within the Analysis ToolPak:
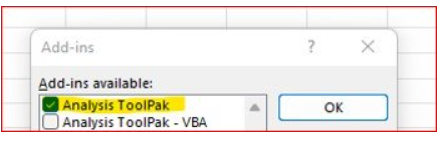
- Ensure you have the necessary add-in enabled for Data Analysis.
- Organize the data and open the Regression calculator.
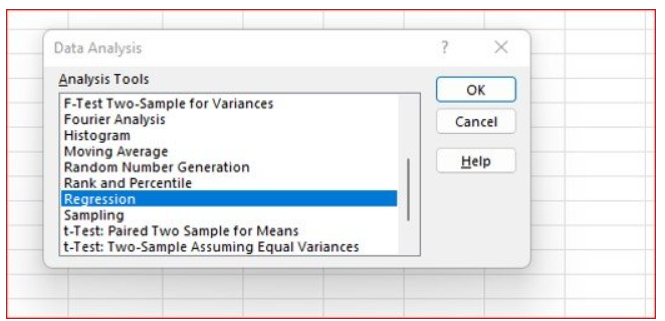
- Select the stock price returns as the “Input Y Range.”
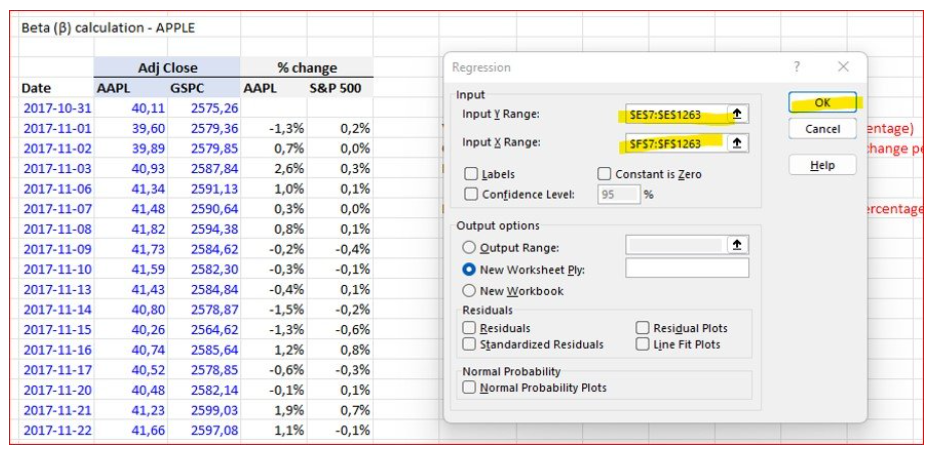
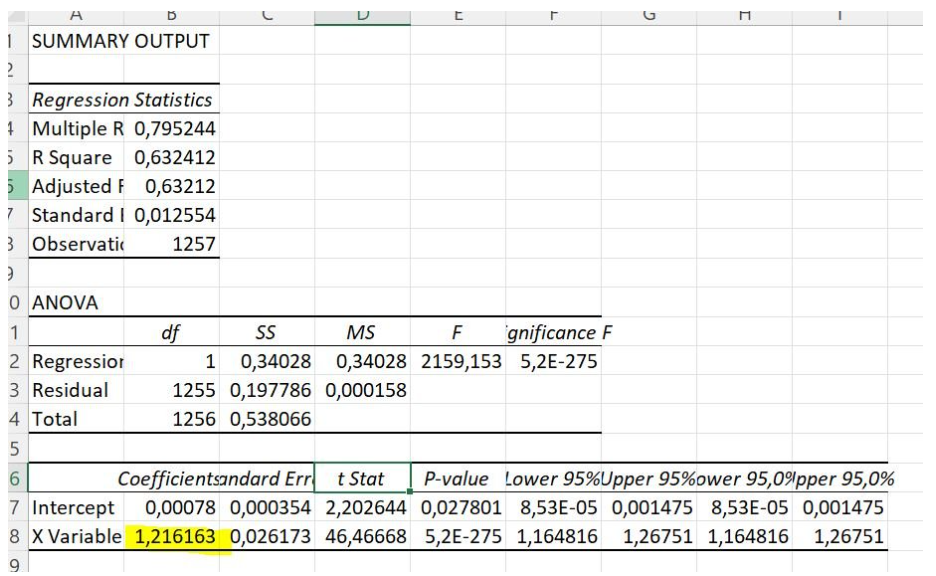
- Find the Beta value in the Coefficients column of the Summary Output sheet.
In Conclusion
In conclusion, mastering the calculation of beta in Excel opens a window to a deeper understanding of market dynamics and risk assessment. Armed with this knowledge, you can confidently evaluate investments, tailor your portfolio to your risk appetite, and make strategic financial decisions.
Remember, beta isn’t just a number – it’s a tool that empowers you to navigate the turbulent waters of the financial world with greater insight and precision. By following the steps outlined in this guide and grasping the essence of beta’s significance, you’re well on your way to becoming a more astute investor.
So, as you embark on your investment journey, let Excel be your trusted companion, helping you unravel the complexities of beta and enabling you to make choices that align with your financial goals.