The use of advanced data analysis tools in Excel can provide critical insights for making informed decisions. One such powerful feature is the two-variable data table, which allows users to visualize how different combinations of two input values impact a given outcome.
In this comprehensive guide, we will explore the mechanics of building two-variable data tables in Excel, walking through the step-by-step process via two illustrative scenarios. Whether you’re a finance professional modeling loan repayments or an operations analyst forecasting production outputs, mastering two-variable data tables is an invaluable skill for superior data-driven decision-making.
Understanding Two-Variable Data Tables
Before delving into the steps to create of Two-Variable Data Tables, it’s essential to establish a solid understanding of their purpose. In essence, a Two-Variable Data Table allows you to explore the impact of two varying input values on a specific outcome. This invaluable feature is a cornerstone for scenario analysis, enabling you to visualize the interplay between different variables effortlessly.
How to Create a Two-Variable Data Table in Excel: Step-by-Step Guide
Creating a Two-Variable Data Table in Excel is a straightforward process. Let’s delve into the mechanics of this powerful feature by going through two different scenarios.
Scenario #1: Loan Amounts and Months
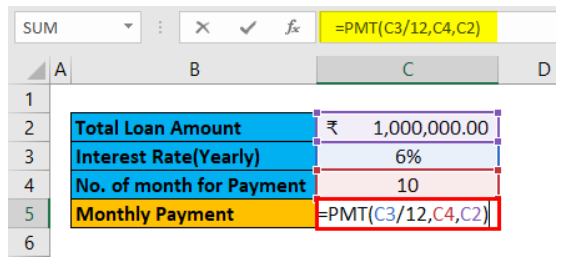
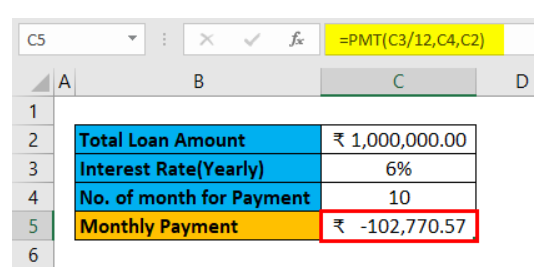
Start with a sample calculation involving a ₹1,000,000.00 loan, a 6% yearly interest rate, and a 10-month EMI/payment period. Apply the PMT formula (=PMT(C3/12, C4, C2)) to obtain a comprehensive breakdown of the calculated EMI.
You’ll get the following result:
Now let’s move on to the steps to create a two-variable data table:
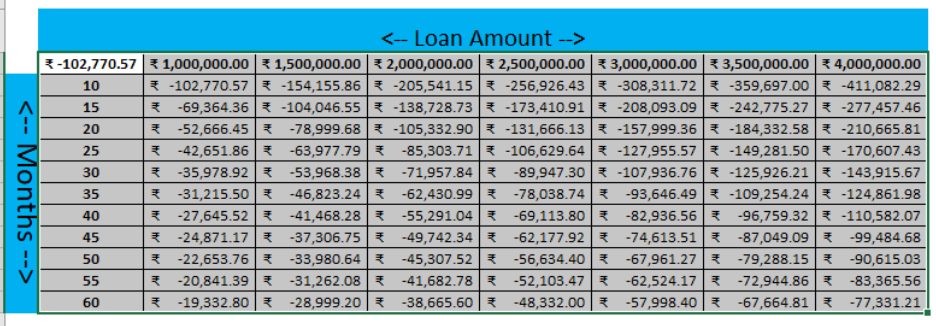
- Step 1: Define desired months in column E and loan amounts in row 4.

- Step 2: Input user-desired months in column F.

- Step 3: Enter desired loan amounts in the 5th row of the sheet.

- Step 4: Select cell F5, input the value of cell C5, and press Enter.

- Step 5: Highlight all datasets from F5 to F16 and F5 to M5.

- Step 6: Navigate to the Data tab, click on the What-if Analysis dropdown, and select Data Table.

- Step 7: In the Data Table popup, set the Loan amount as the Row input cell and the number of months for Payment as the Column input cell. Click OK.

- Step 8: Witness the monthly loan repayment amounts based on the combination of each month and loan amount dataset.
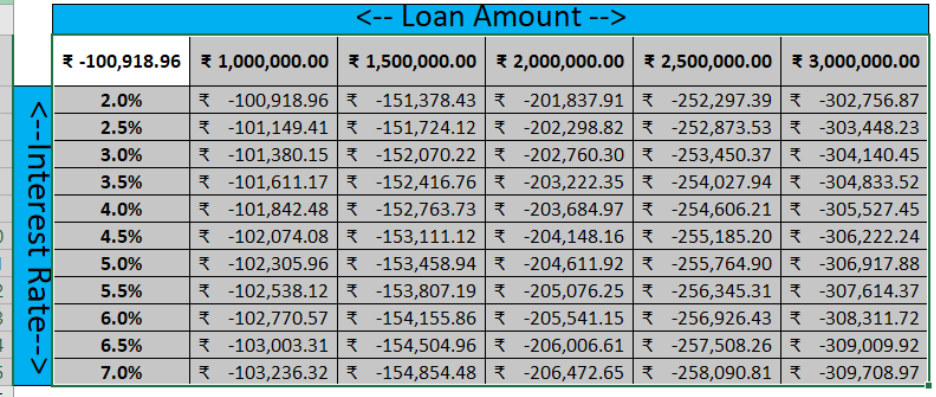
Scenario #2: Loan Amounts and Interest Rates
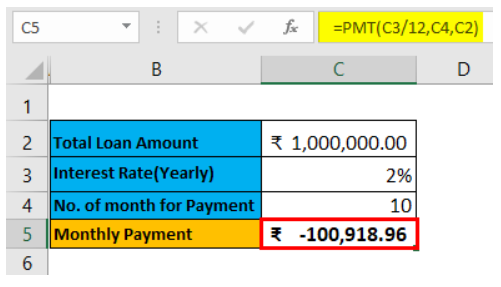
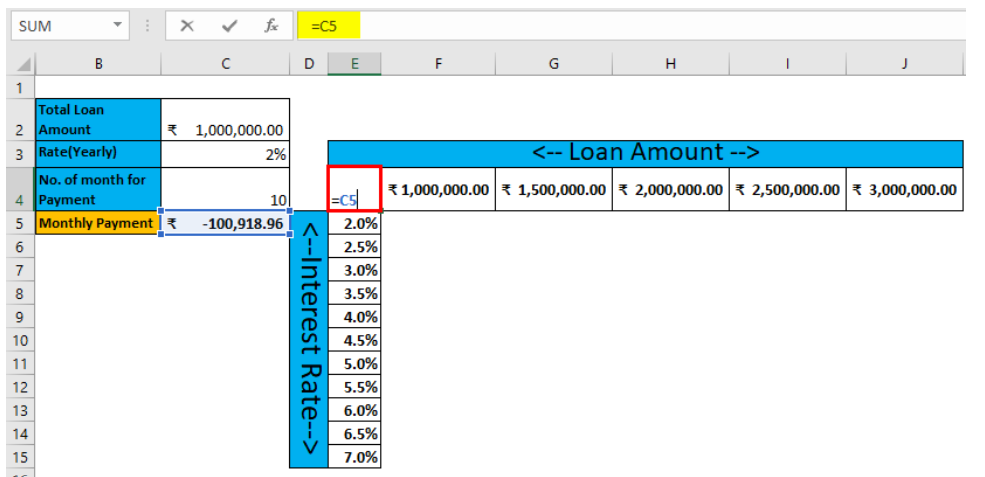
As a prerequisite, conduct a sample calculation with a Total loan amount of ₹1,000,000.00, a 2% yearly Interest Rate, and a 10-month EMI period. Apply PMT formulas (=PMT(C3/12, C4, C2)) for precise EMI calculations.
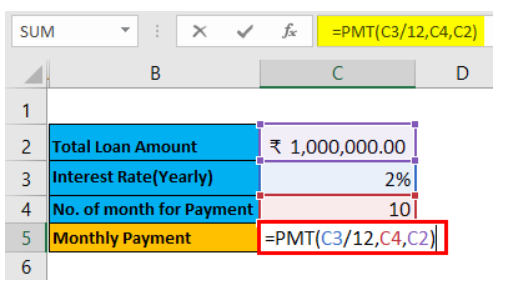
You’ll get the result like this:
Now let’s move on to the steps to create two-variable data table:
- Step 1: Record desired Interest rates in column D and loan amounts in row 3.
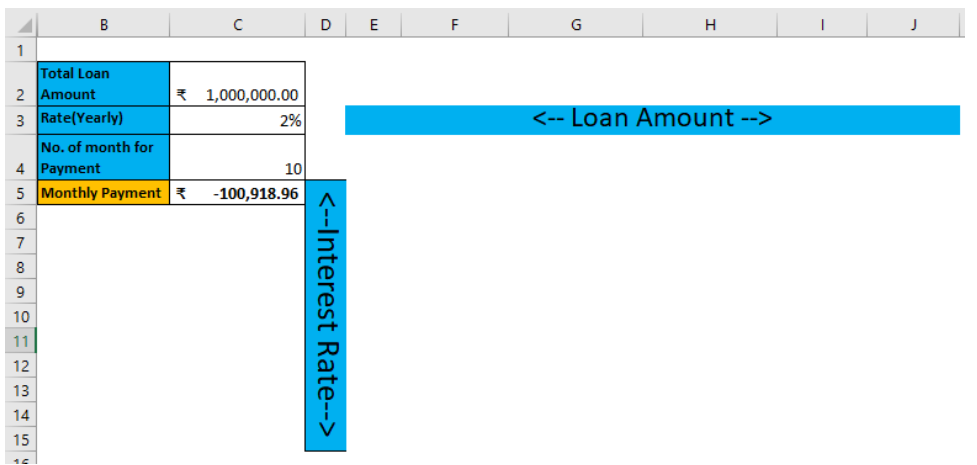
- Step 2: Input user-desired interest rates in column E.
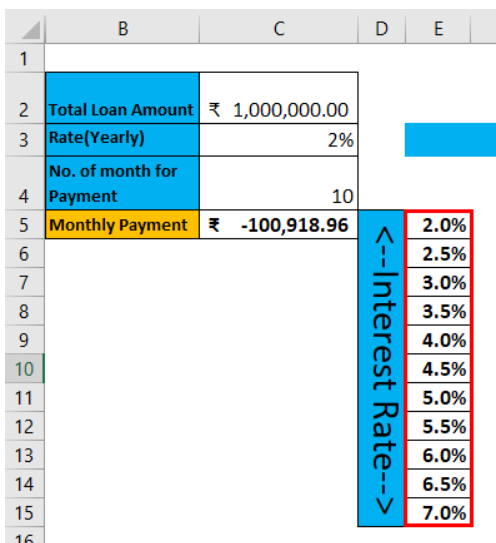
- Step 3: Enter desired loan amounts in the 4th row of the sheet.
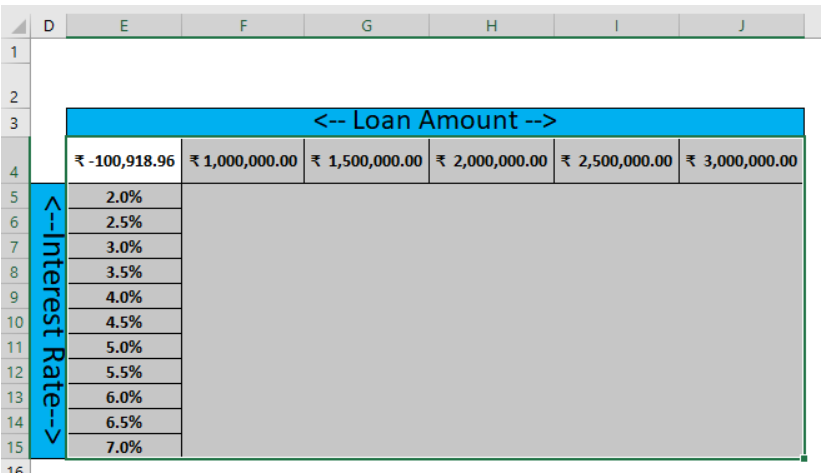
- Step 4: Select cell E4, input the value of cell C5, and press Enter.
- Step 5: Highlight all datasets from E4 to E15 and E4 to J4.
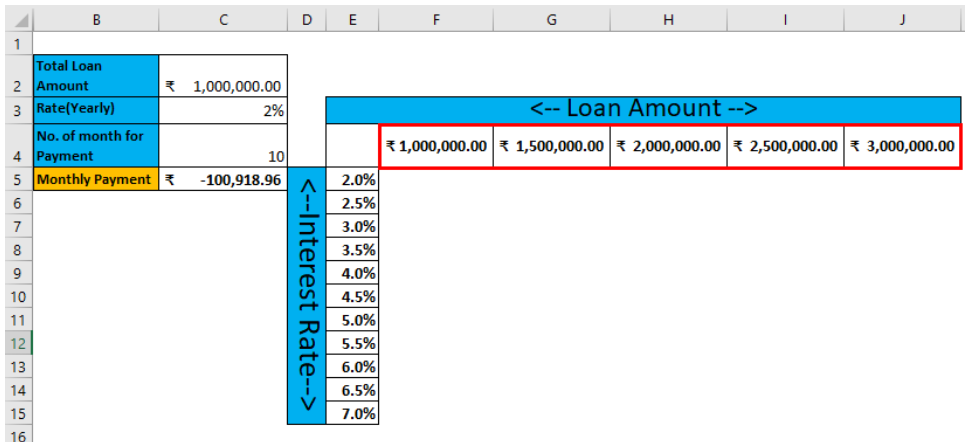
- Step 6: Go to the Data tab, click on the What-if Analysis dropdown, and select Data Table.
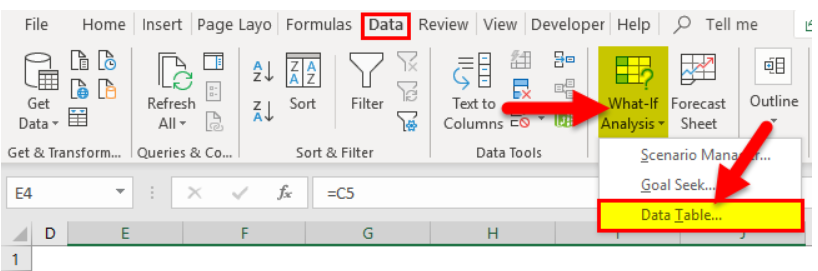
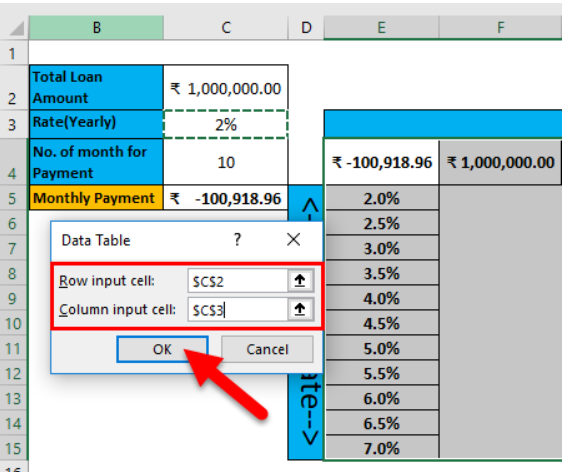
- Step 7: In the Data Table popup, set the Loan amount as the Row input cell and the interest rate as the Column input cell. Click OK.
- Step 8: Explore the monthly loan repayment amounts based on different interest rates and loan amount datasets.
Advanced Features for Precision Analysis
Goal Seek: A Tool for Refined Analysis
In conjunction with Two-Variable Data Tables, Excel offers the powerful Goal Seek tool. This feature enables you to reverse-engineer your analysis, allowing you to set a specific outcome and let Excel determine the necessary input values.
Scenario Manager: Crafting Realistic Scenarios for Insightful Decisions
For a more nuanced approach, integrate the Scenario Manager into your analysis. This tool empowers you to create and compare multiple scenarios, providing a holistic view of how different variables can influence outcomes under diverse conditions.
Tips for Optimization and Troubleshooting
As you delve deeper into the world of Two-Variable Data Tables, here are some pro tips to ensure a seamless experience:
- Data Validation: Validate your input data to eliminate errors and enhance the reliability of your analysis.
- Sensitivity Analysis: Conduct sensitivity analysis to identify which variables have the most significant impact on your outcomes.
- Graphical Representation: Supplement your data tables with visual aids like charts and graphs to enhance comprehension.
Conclusion
In closing, two-variable data tables are an indispensable tool for conducting multivariate scenario analysis in Excel. By synergizing these tables with complementary features like Goal Seek and Scenario Manager, users can gain sophisticated insights into complex problems. However, sound implementation requires validating inputs, running sensitivity checks, and utilizing visual aids for optimal comprehension.
With practice and the right analytical approach, two-variable data tables can transform the way finance, operations, and business professionals leverage Excel to make strategic data-driven decisions. Master this technique to enhance your workspace skills and take your data analysis game to the next level.