In the fast-paced world of business, making informed decisions is paramount. Whether you’re managing a project, monitoring employee performance, or tracking key performance indicators (KPIs), having a visual representation of data can significantly enhance your analytical capabilities. One powerful tool for this purpose is a scorecard, and creating one in Excel is a game-changer.
In this article, we’ll explore the importance of creating a scorecard in Excel, how it simplifies analysis, and delve into the multiple uses of this versatile tool.
The Importance of a Scorecard in Excel
A scorecard is essentially a visual representation of performance data, typically presented in a tabular format. Using Excel to create a scorecard offers numerous advantages, making it an indispensable tool for businesses. Here are some key reasons why it’s crucial to leverage Excel for scorecard creation:
-
User-Friendly Interface:
Excel’s intuitive interface makes it accessible to users with varying levels of expertise. You don’t need to be a data scientist to create a scorecard – Excel’s familiar grid layout and simple formulas make the process straightforward.
-
Flexibility and Customization:
Excel allows you to customize your scorecard based on your specific needs. From choosing the right color scheme to tailoring formulas, Excel provides unparalleled flexibility in creating a scorecard that aligns with your objectives.
-
Real-Time Updates:
Excel enables you to link your scorecard to live data sources, ensuring that your information is always up-to-date. This real-time aspect is crucial for dynamic environments where continuous monitoring and quick decision-making are essential.
-
Graphical Representation:
Beyond tables, Excel offers powerful charting tools. Integrating graphs into your scorecard can provide a visual snapshot of trends, making it easier to identify patterns, outliers, and areas that require attention.
How Scorecards Simplify Analysis in Excel
Creating a scorecard in Excel simplifies the analysis process by condensing complex data into an easy-to-understand format. Here’s how:
-
Centralized Data Storage:
Excel allows you to consolidate data from various sources into a single spreadsheet. This centralized approach eliminates the need to sift through multiple documents or databases, streamlining the data gathering process.
-
Automated Calculations:
Excel’s formulas and functions automate calculations, reducing the likelihood of errors associated with manual computations. This not only saves time but also enhances the accuracy of your analysis.
-
Dynamic Data Visualization:
Excel’s charting tools enable you to dynamically visualize data trends. Whether it’s a line graph tracking sales over time or a pie chart illustrating the distribution of resources, these visual elements enhance comprehension and aid in quick decision-making.
-
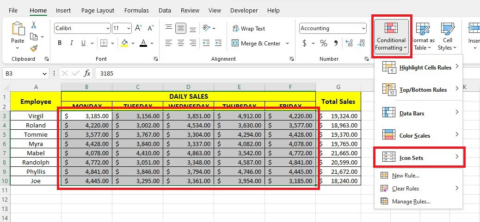
Conditional Formatting for Quick Insights:
Excel’s conditional formatting feature allows you to highlight specific data points based on predefined criteria. This visual emphasis draws attention to critical information, making it easier to identify trends, outliers, or areas of concern at a glance.
Multiple Uses of a Scorecard in Excel
-
Project Management:
Scorecards in Excel are invaluable for project managers. They can track project milestones, budget adherence, resource allocation, and team performance. Color-coded indicators can quickly signal if a project is on track or if adjustments are needed.
-
Employee Performance Monitoring:
Human resources departments can utilize Excel scorecards to evaluate employee performance. Key metrics such as sales targets, project completion rates, and attendance records can be efficiently tracked, facilitating objective performance reviews.
-
Financial Analysis:
In finance, Excel scorecards are indispensable for tracking key financial metrics. From budget variances and profit margins to return on investment (ROI) calculations, financial analysts can use scorecards to gain a comprehensive view of a company’s financial health.
-
Sales and Marketing Tracking:
Sales teams can benefit from Excel scorecards by monitoring sales targets, conversion rates, and customer acquisition costs. Marketing professionals can use scorecards to evaluate the effectiveness of campaigns, track leads, and analyze customer feedback.
-
Quality Control and Process Improvement:
Manufacturing and production industries can employ scorecards in Excel for quality control and process improvement. By tracking defect rates, production cycle times, and resource utilization, organizations can identify areas for optimization.
Conclusion
Creating a scorecard in Excel is a powerful strategy for enhancing data analysis across various domains. Its user-friendly interface, flexibility, and real-time capabilities make it a go-to tool for professionals seeking to transform raw data into actionable insights.
Whether you’re managing projects, evaluating employee performance, or conducting financial analysis, an Excel scorecard is a versatile instrument that can significantly elevate your decision-making processes. Embrace the power of Excel, and unlock the potential of your data to drive success in your business endeavors.