Return on Investment (ROI) is a vital financial metric used by investors, financial analysts, and businesses to evaluate the profitability of investments and projects. ROI measures the net gains or losses generated on an investment relative to the total capital invested. Although Excel does not have a predefined ROI function, it can easily be calculated by using simple formulas. In this comprehensive guide, we will explore everything you need to know about calculating ROI in Excel.
What is Return on Investment (ROI)?
ROI calculates the net profit or loss from an investment expressed as a percentage of the total investment costs. It is determined by dividing the net returns by the total capital invested.
ROI Formula:
ROI % = (Net Profit / Total Investment Cost) x 100
A higher ROI percentage indicates greater efficiency in generating returns on the invested capital. ROI can be used to evaluate returns on individual assets, projects, departments, or an overall portfolio of investments.
ROI helps investors and businesses understand if capital is being used profitably to generate adequate returns. Key uses of ROI include:
- Comparing returns between different investment options
- Assessing if an asset or project’s performance is improving over time
- Setting profitability goals and performance benchmarks
- Determining capital allocation strategy based on returns
Why Measure Return on Investment (ROI)?
There are several important benefits to incorporating ROI calculations:
- Evaluate profitability – ROI shows the profit generated per unit of investment, quantifying capital efficiency.
- Compare opportunities – ROI provides a standardized metric to contrast returns across different investment types.
- Monitor performance – Tracking ROI over time illustrates whether investment returns are increasing or decreasing.
- Guide funding decisions – ROI directs capital allocation towards opportunities with the highest potential returns.
- Set targets – ROI helps establish profitability objectives, growth goals, and return thresholds.
Step-by-Step Guide to Calculating ROI in Excel
Although Excel does not have a built-in ROI function, it can easily be calculated using simple formulas:
ROI = Total Return – Initial Investment
And if you want to calculate the Percentage of ROI, you can use the below formula:
“ROI% = Total Return – Initial Investment / Initial Investment * 100
Calculating ROI Examples in Excel
Let’s look at some examples to calculate ROI in Excel using the formulas:
Example 1
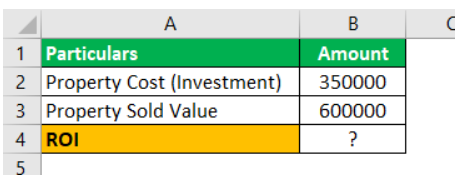
A man purchased a property in Jan 2015 for $3,50,000. After 3 years, in Jan 2018, he sold the property for $6,00,000.
Initial Investment: $3,50,000
Sold Value: $6,00,000
Now we have to find the ROI value by using thee given information:
Applying the ROI formula:
ROI = Sold Value – Initial Investment
Here, we’ll place the cell reference of each value respectively
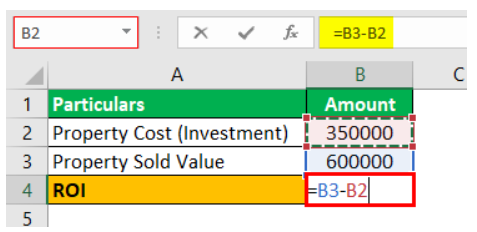
= $6,00,000 – $3,50,000 = $2,50,000

To calculate ROI percentage:
ROI% = (ROI/Initial Investment) x 100 = ($2,50,000/$3,50,000) x 100 = 71.43%

Over 3 years, the man has earned a 71.43% ROI on his real estate investment.
Example 2
On 15th Jan 2019, a man purchased 150 shares at $20 per share. On 31st Aug 2019, he sold the 150 shares at $30 per share.

So, now we have to calculate its ROI
Initial Investment = 150 x $20 = $3,000

Sold Value = 150 x $30 = $4,500

ROI = Sold Value – Initial Investment
Again enter the cell reference of each value respectively

= $4,500 – $3,000 = $1,500

ROI% = (ROI/Initial Investment) x 100 = ($1,500/$3,000) x 100 = 50%
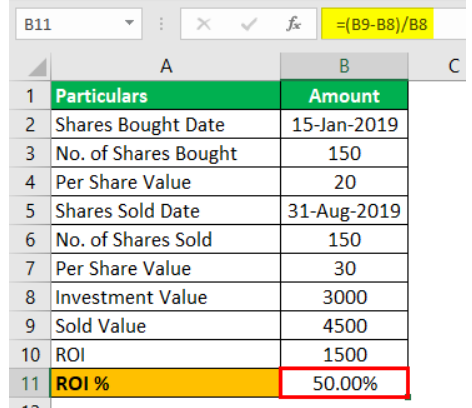
Over the period from Jan 15 to Aug 31, the man earned a 50% ROI on his share investment.
Using ROI to Compare Investments
One of the key benefits of calculating ROI in Excel is the ability to compare returns across different investments. For example:
- A man invested $50,000 in stocks and earned a 20% ROI
- He invested $75,000 in bonds and earned a 12% ROI
- He invested $1,00,000 in real estate and earned a 15% ROI
By calculating and organizing the ROI of each investment in columns in Excel, the man can easily see that stocks provided the highest ROI. This enables data-driven capital allocation decisions.
Tips for Comparing Investment ROI in Excel:
- Use consistent inputs and metrics for each calculation
- Annualized returns over the same periods
- Sort highest to lowest ROI percentage
- Apply conditional formatting to highlight top performers
- Include columns for totals to compare amounts invested
- This enables data-driven capital allocation based on ROI analysis.
Conclusion
In summary, Excel provides an easy, flexible way to calculate ROI for individual assets or entire portfolios. By separating inputs into different cells, ROI can be calculated using basic formulas. Tracking ROI helps assess profitability, set performance targets, and inform strategic investment decisions based on returns.
Factoring time value into the ROI calculation provides a more accurate representation of investment performance over time. With knowledgeable analysis, ROI calculated in Excel can drive smart financial and investment choices.