Highlighting cells in Excel allows users to visually distinguish important data points and color code information for quick parsing. However, to fully utilize highlighted cells, it’s crucial to know how to count them. However, the absence of a built-in function for counting colored cells often deters users from leveraging this aesthetic feature.
But fear not, as this article will explore the oft-overlooked technique that enables users to count highlighted Excel cells and unlock their utility. Whether you’re an Excel newbie or a power user, this guide will equip you with the knowledge to count colors and get more out of highlighting. So read on to learn how to count highlights like a pro and take your Excel skills to the next level!
The Power of Highlighting in Excel
Before we dive into the nitty-gritty of counting highlighted cells in Excel, let’s first understand why highlighting cells can prove tremendously useful:
- Highlight Important Data: Colors allow you to visually distinguish key data points, relationships, and trends.
- Color Code Information: Use different colors to categorize diverse types of data for quick visual parsing.
- Enhance Aesthetics: Colors simply make your Excel sheets more visually appealing.
- Avoid Monotony: Adding color paradigms to cells breaks the monotony of black and white spreadsheets.
By leveraging the power of colors, you can enhance your Excel workbooks’ utility and visual allure. However, the utility is drastically diminished if you cannot quantify your highlighted data. So let’s get equipped to count those highlighted cells efficiently.
Counting Highlighted Cells: Find & Select
The Find & Select command emerges as a powerhouse tool for executing diverse Excel-related tasks. In this context, we will harness its capabilities to tally colored cells in Excel and unravel the count of cells under specific hues.
Step-by-Step Guide:
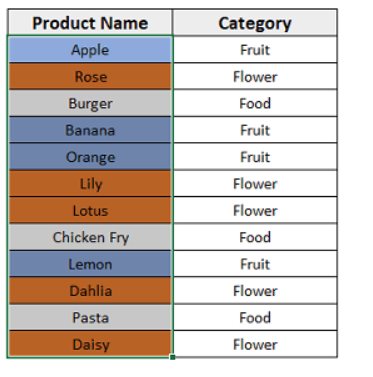
Select Your Colored Dataset:
First, use your mouse to select the range of cells containing the highlighted cells you wish to count. This builds the foundation.
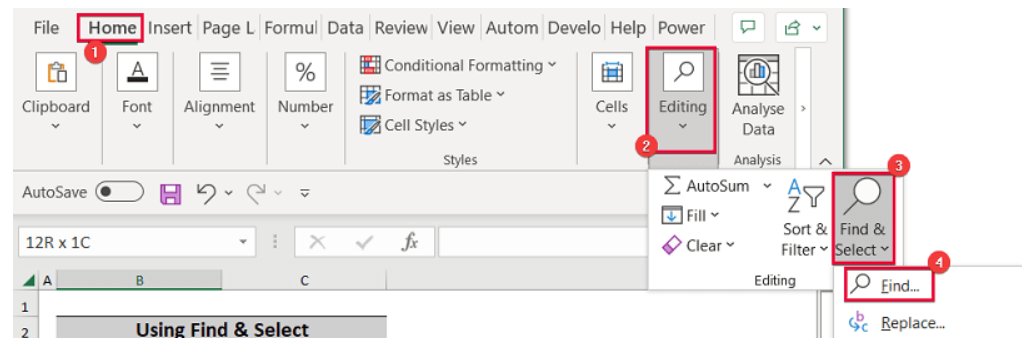
Initiate Find & Select:
In the Home tab of the Excel ribbon, navigate to the Edition Section. Click on ‘Find & Select’ under the Editing section and choose Find. Alternatively, you can use the keyboard shortcut CTRL+F.
Access Additional Options:
The Find and Replace dialog box will open up. Click on the Options button at the bottom to access additional options.
Choose Format From Cell:
From the drop-down menu next to ‘Format,’ select ‘Choose Format from Cell’.

Color Identification:
A wand-like cursor will now be visible. Hover over any cell filled with the color you want to count and click.

Verify Color Match:
The color of the clicked cell will show up under ‘Preview’. Observe the Preview label box in the Find and Replace box, now filled with a color akin to your selected cell.
Execute Find All:
Finally, click on the ‘Find All’ button.

Voila! Excel will showcase a list of all cells in the selected data range that match the chosen color.

The total count will also be displayed.epeating the Process:
Repeat these steps to count cells of other colors throughout your Excel worksheet, providing you with a holistic overview of your colorful data.
And you’re all set! By leveraging the Find & Select tool in this manner, you can easily count cells based on their fill color in Excel. You’ll be able to calculate the frequency of differently colored cells in your dataset.
Some Advanced Techniques to Count Highlighted Cell Counting
Proficient Excel users can also employ formulas and filters to quantify highlighted cells in their worksheets. Here’s a quick look at how that can be achieved:
- Conditional Formatting Formula: Use Excel’s COUNTIF function to return the count of cells that meet specific color criteria.
- Subtotals & Filters: Subtotal highlighted rows/columns using cell colors as the pivot. Then filter to count.
- VBA Macros: Develop Visual Basic macros that loop through all cells and tally those with specific fill colors.
These advanced techniques provide added flexibility and precision when counting highlighted cells across extensive and complex Excel worksheets. Learn to create your own custom Excel formulas, filters, and macros to count colors like a pro.
Unleash the Full Potential of Cell Highlighting
Now that you’re equipped with techniques to accurately count highlighted cells, you can color your Excel data fearlessly without losing quantifiability. Here are some creative ways to push the boundaries with highlighting:
- Traffic Light Ratings: Use red, yellow, and green fills as visual ratings on key metrics.
- Schedules & Calendars: Visually demarcate schedules, timelines, and calendars using an array of colors.
- Charts & Graphs: Color code the data markers on your Excel charts for added visual pop.
- Icon Sets: Leverage Excel’s Icon Set feature to associate colors with data benchmarks and thresholds.
- Reports & Dashboards: Use colors extensively to enhance visual appeal in reports, scorecards, and dashboards.
Bottom Line
In conclusion, with the ability to accurately count highlighted cells in Excel, you can fully harness the power of colors to enhance your spreadsheets. Strategic use of highlights allows you to flag key data, color code information, improve aesthetics, and add visual interest. Whether you’re creating dashboards, calendars, reports, or just regular spreadsheets, highlight cells liberally without losing quantifiability.
Counting highlights may seem daunting initially but is easy to master. Implement these best practices to get more out of colored cells and take your Excel abilities to the next level, all while making your spreadsheets more engaging and information-rich.