Calculating a weighted average in Excel is easy once you know how. A weighted average accounts for the different levels of significance applied to numbers in a data set. By assigning weights to each data point, you can get an average that better reflects the overall significance.
In this comprehensive guide, you’ll learn step-by-step how to calculate a weighted average in Excel using formulas.
What is a Weighted Average?
A weighted average is a calculation that takes into account the varying degrees of importance of numbers in a data set. Each number is multiplied by a weight factor before all values are summed and divided by the total weights to get the weighted average.
The weight assigned to each number determines its contribution to the overall average. Numbers with a larger weight contribute more to the final average than numbers with smaller weights.
Weighted averages allow certain data points to take precedence over others when calculating an average. This results in the final average being skewed towards the data points with the largest weights.
Why Use a Weighted Average?
Weighted averages have several important applications in statistics and data analysis. Here are some of the key reasons you may need to calculate a weighted average:
Adjust for Unequal Importance
In many cases, not all numbers in a data set should be treated equally. A weighted average allows you to apply different weights to certain numbers to reflect their significance.
For example, when calculating a student’s final grade you would want to assign larger weights to exams than homework assignments. This prevents less important homework grades from skewing the final average.
Combine Data Sets with Different Sizes
If you need to combine data sets containing different numbers of data points, using a simple arithmetic mean could skew the results.
Applying weights to each data set based on its size before calculating the average prevents sets with more data points from dominating the final result.
Reduce Impact of Outliers
Weighting allows you to minimize the effects of outlier data points on the final average. Numbers that fall outside the normal range can be assigned smaller weights so they don’t skew the mean.
Account for Probability
Weighted averages allow you to account for the probability of certain outcomes when dealing with forecasting or predictive data analytics. More likely outcomes can be assigned larger weights.
How to Calculate a Weighted Average in Excel
Calculating a weighted average in Excel requires just a few simple steps. We’ll walk through an example to demonstrate the process.
1. Set up your data
Begin by organizing your data set with the numbers you want to average in one column and the corresponding weights in the next column:
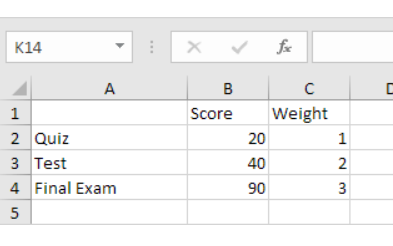
In this example, we are calculating the weighted average test score for a Quiz, Test and Final Exam.
2. Multiply values by weights
To give more weight to certain values, we multiply each number by its assigned weight:
Here we’ve added a column where each test score is multiplied by the points available for that test. This gives exams with more points a larger impact on the weighted average.
3. Sum the weighted values
Now add up all of the weighted values using the SUM function:
=SUM(C2:C4)
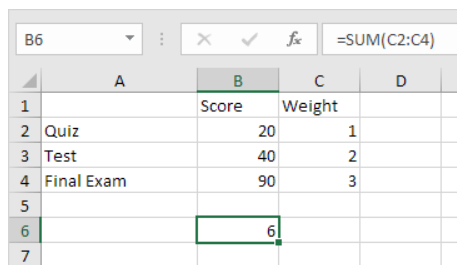
This gives us the sum of the weighted values:
4. Sum the weights
Next, add up all of the weights using SUMPRODUCT:
=SUMPRODUCT(B2:B4.C2:C4)

This gives us the total weights:
5. Divide the weighted sum by total weights
Finally, divide the sum of weighted values by the sum of weights to get the weighted average:
And the weighted average appears:

And that’s it! By following these 5 simple steps you can easily calculate a weighted average in Excel.
How to Calculate Weighted Average Using SUMPRODUCT
An alternative to using separate columns for the weighted values and sums is the SUMPRODUCT function.
SUMPRODUCT allows you to get the weighted average with a single function:
=SUMPRODUCT(values, weights) / SUM(weights)
For example:
=SUMPRODUCT(B2:B4, C2:C4) / SUM(C2:C4)

This multiplies the values and weights arrays together and sums the products, then divides by the sum of the weights.
SUMPRODUCT makes calculating a weighted average simpler, eliminating extra columns and manual multiplication.
Common Errors to Avoid
When working with weighted averages, there are a few common errors to watch out for:
- Forgetting to multiply values by weights before summing
- Mixing up which columns contain values vs weights
- Dividing by the wrong sum amount
- Including blank cells in your ranges
- Not updating cell references after adding new data
- Checking your formula and ranges carefully before hitting enter can help you avoid any #DIV/0!, #REF!, or other errors.
Weighted Average Tips and Tricks
- Format numbers in the weights column as percentages to scale them between 0-100% to make weighting easier.
- Use absolute references for weights ($B$2) if you want them to remain constant when copying formulas.
- Name your value and weight ranges to make formulas more readable.
- Add data validation to prevent entry of invalid weights.
- Use conditional formatting to highlight outliers or concerning weighted averages.
Conclusion
In this comprehensive guide, we walked through what weighted averages are, why they are used, and step-by-step instructions for calculating them in Excel. You learned how to set up your data, multiply values by weights, sum the results, and divide by the total weights to derive the weighted average.
Excel formulas like SUM and SUMPRODUCT make the calculations easy. Weighted averages are an indispensable tool for any analyst or Excel user working with datasets where certain values require more influence on the final average. Now that you are a pro at calculating weighted averages in Excel, you can apply them to make better data-driven decisions.