Are you ready to unlock the power of data analysis and make informed decisions? Excel, the ubiquitous spreadsheet tool, isn’t just for organizing numbers; it’s a versatile platform for conducting regression analysis, a fundamental statistical technique that helps us understand relationships between variables.
Whether you’re a seasoned data analyst or a curious novice, this blog post is your guide to mastering the art of running a regression in Excel. In the next few minutes, we’ll demystify the process, step by step, and empower you with the skills to extract valuable insights from your data. Let’s dive into the world of regression analysis right here in your Excel workbook.
Understanding Regression Analysis
Before diving into the practical aspects of running a regression in Excel, it’s essential to grasp the fundamental concept of regression analysis. At its core, regression analysis is a statistical method used to examine the relationship between a dependent variable and one or more independent variables. This analysis helps us understand how changes in the independent variables impact the dependent variable.
Setting the Stage: Data Preparation
The first and crucial step in performing regression analysis in Excel is data preparation. Garbage in, and garbage out holds true in data analysis, so ensure your data is clean and well-organized. Follow these steps to set the stage for regression analysis:
Data Collection: Gather all the data you need for your analysis. Ensure that you have a clear understanding of your dependent and independent variables.
Data Cleaning: Clean your data by removing any duplicates, errors, or outliers that could skew your results. Excel provides various tools for data cleaning and validation.
Data Organization: Organize your data into columns, with each column representing a variable. Label your columns appropriately for clarity.
Performing Regression Analysis in Excel
Now, let’s get into the nitty-gritty of running a regression analysis in Excel.
Data Entry: Open Excel and enter your data into a spreadsheet. Ensure that your dependent variable is in one column, and your independent variables are in separate columns.
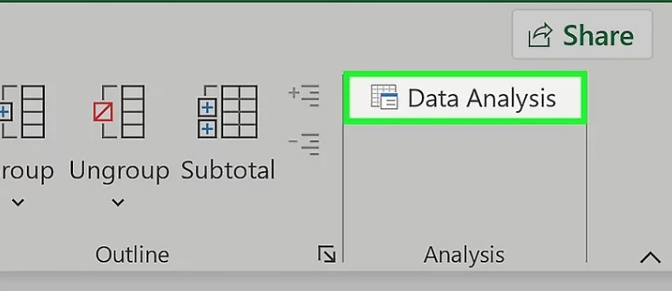
Regression Tool: Excel provides a built-in tool for regression analysis. To access it, go to the “Data” tab and click on “Data Analysis.”
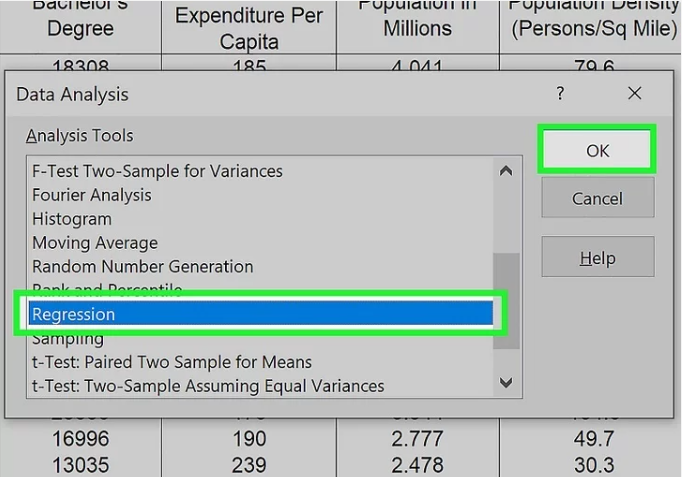
Choose “Regression” from the list of analysis tools.
Input Range: In the Regression dialog box, specify the input range for your data. Select the dependent variable as the “Y” variable
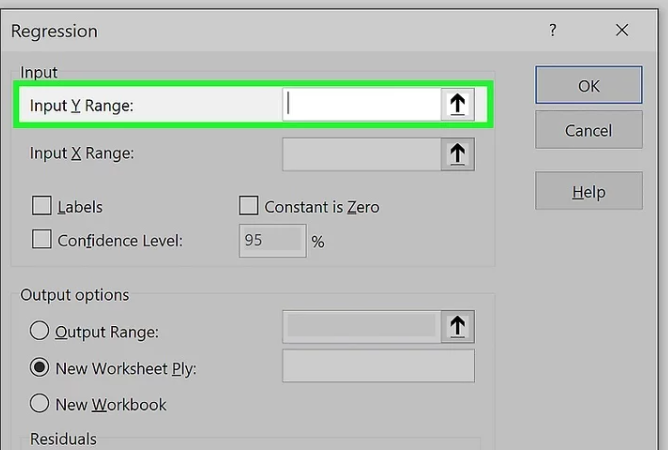
and the independent variables as the “X” variables.

Output Options: Choose where you want Excel to place the regression results. You can either have the results displayed in a new worksheet or on the same worksheet.
Regression Statistics: Excel provides a plethora of statistical information in the regression output, including coefficients, standard errors, R-squared values, and more. These statistics are essential for interpreting the results of your analysis.
Interpreting and Making Informed Decisions
Coefficients: The coefficients in the regression output represent the relationship between the independent variables and the dependent variable. A positive coefficient means there’s a positive connection, and a negative coefficient signifies a negative relationship..
R-squared Value: The R-squared value, often referred to as the coefficient of determination, indicates the goodness of fit of the regression model. It spans from 0 to 1, where greater values suggest a stronger fit.
Hypothesis Testing: Use hypothesis testing to determine if the coefficients are statistically significant. A low p-value suggests that the variable has a significant impact on the dependent variable.
Predictions: Once you’ve successfully run a regression in Excel and interpreted the results, you can use the model to make predictions. Simply input values for the independent variables.

Click OK and Excel will calculate the predicted value of the dependent variable.

Conclusion
In this comprehensive guide, we’ve walked you through the process of mastering regression analysis in Excel. From understanding the fundamentals to performing regression analysis and interpreting the results, you now have the knowledge to harness the power of Excel for data analysis.
Remember that practice makes perfect. The more you work with regression analysis in Excel, the more proficient you’ll become. So, roll up your sleeves, dive into your data, and start uncovering valuable insights today.