Variance calculation in Excel is a crucial statistical analysis tool that allows you to measure the spread or dispersion of data points in a dataset. Whether you’re a business analyst, a student, or simply someone looking to harness the power of Excel, understanding how to calculate variance is essential. In this comprehensive guide, we’ll walk you through the process step by step. Let’s get started!
What Is Variance?
Before we delve into the intricacies of calculating variance in Excel, let’s first establish what variance is and why it’s important. Variance is a statistical measure that quantifies the degree of dispersion or spread in a set of data points. It provides valuable information about the variability within a dataset. High variance suggests that data points are widely spread out from the mean, while low variance indicates that data points are clustered closely around the mean.
Why Calculating Variance Matters
Understanding variance is crucial in various fields, including finance, quality control, and scientific research. Here are a few reasons why calculating variance is essential:
1. Risk Assessment in Finance
In the world of finance, variance is a fundamental tool for risk assessment. It helps investors and analysts evaluate the volatility of investments, enabling them to make informed decisions about portfolio diversification and risk management.
2. Quality Control in Manufacturing
Manufacturers use variance analysis to assess the consistency of their production processes. By monitoring variance, they can identify deviations from expected outcomes and take corrective actions to improve product quality.
3. Scientific Research and Data Analysis
Researchers rely on variance to measure the spread of data in experiments. It allows them to draw meaningful conclusions and determine the reliability of their findings.
Calculating Variance in Excel: A Step-by-Step Guide
Launching Excel on Your Windows PC
To begin your journey towards calculating variance in Excel, follow these initial steps:
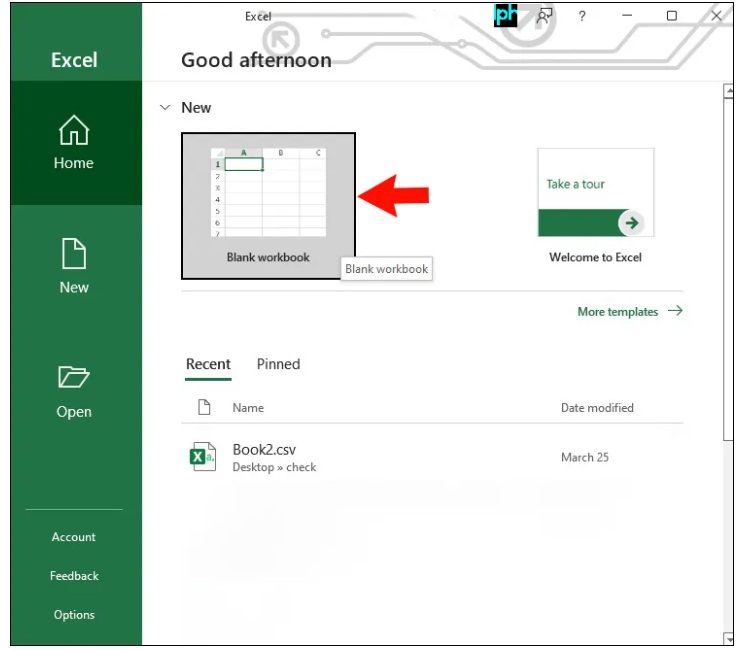
- Launch Excel on your Windows PC.
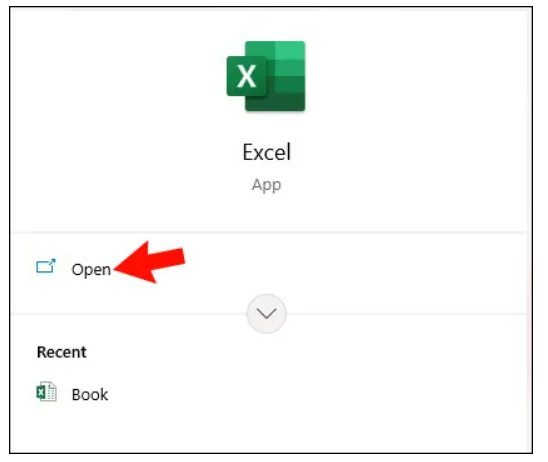
- Open the Spreadsheet: If you have an existing spreadsheet where you want to find the variance, open it. Alternatively, if you need to create a new spreadsheet, select “Blank workbook.”
Entering Data
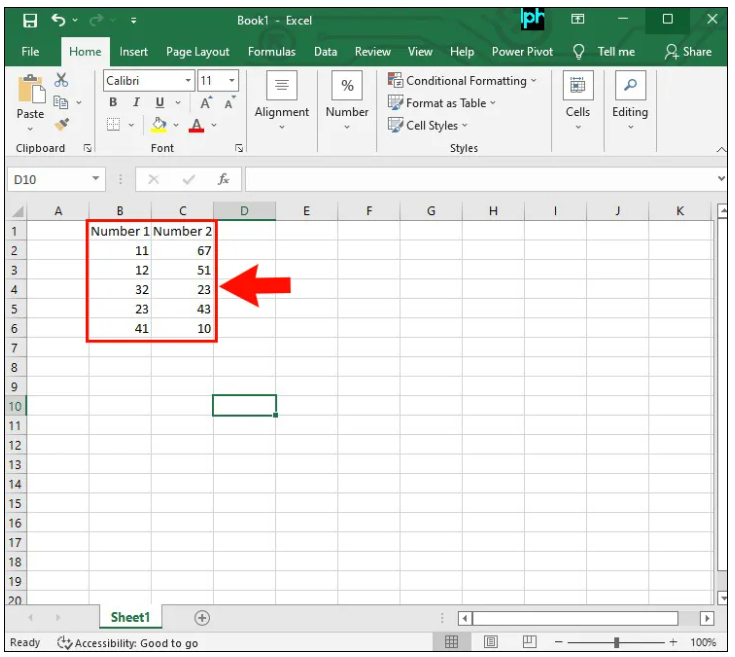
Before diving into the variance calculation, it’s essential to input your data correctly:
Enter the Necessary Data: Populate your spreadsheet with the relevant data. Ensure that all data is entered within a specific range, either in a column or a row. This step is crucial as variance calculations depend on data within a specific range.
Calculating Variance
Now, let’s proceed to calculate the variance:
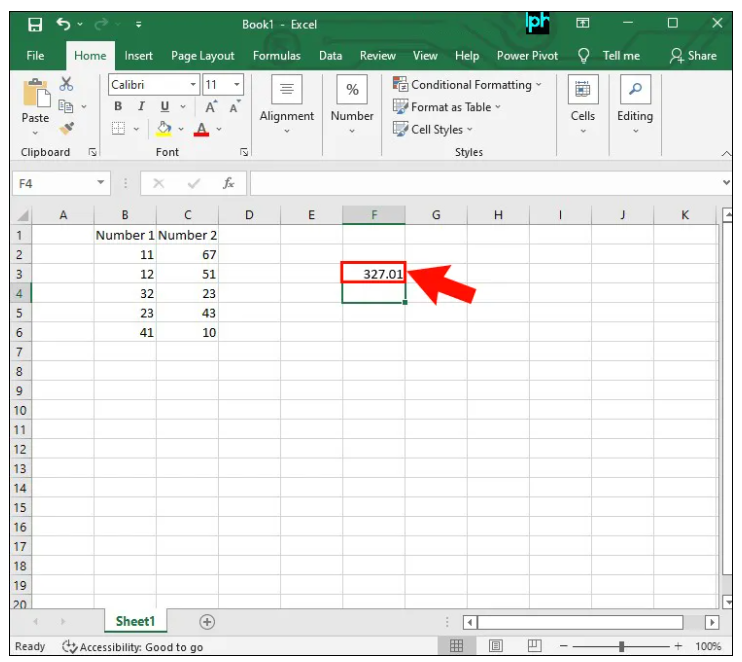
- Select an Empty Cell: Double-click on an empty cell anywhere within your spreadsheet.

- Entering the Formula: Type in the formula to calculate variance. For most Excel versions, use “=VAR.” If you have the latest Excel version, you can use “=VAR.S.”

- Specify the Data Range: In parentheses, specify the data range you want to calculate the variance for. For example, “(B2:B11)”.

- Calculate Variance: Press the “Enter” key. The variance will immediately appear in the same cell where you entered the function.

Calculating Population Variance
If you need to calculate population variance, follow these steps:
- Access Your Spreadsheet: Open Excel and navigate to your spreadsheet.
- Select an Empty Cell: Double-click on an empty cell where you want to display the population variance.

- Entering the Formula: Type in the formula for population variance. For newer Excel versions, use “=VARP” or “=VAR.P.”

- Specify the Data Range: In parentheses, enter the data range you want to use for the population variance calculation. For example, “(A2:A15).”
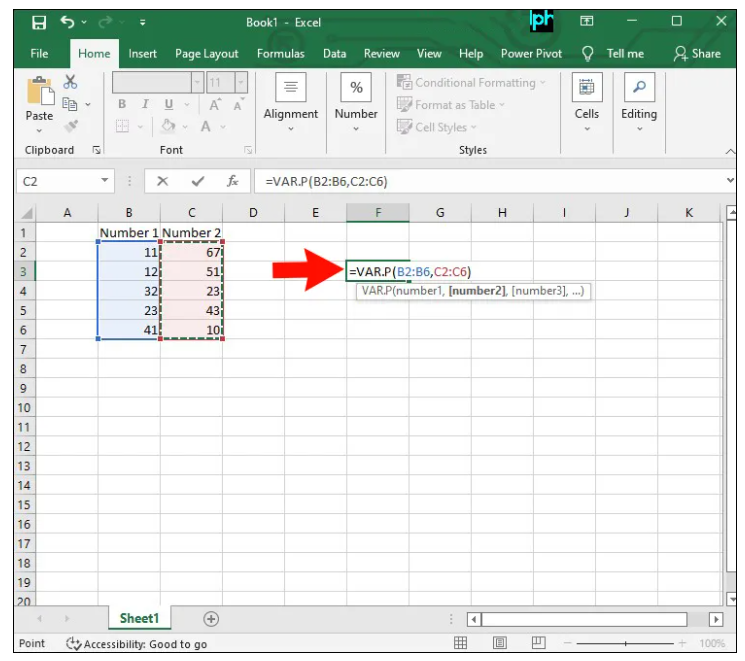
- Calculate Population Variance: Press “Enter.” The population variance will appear in the same cell where you entered the formula.
Conclusion
Calculating variance in Excel is a valuable skill for anyone working with data analysis. By following these straightforward steps, you can easily determine the spread or dispersion of your data points. Remember, Excel is not just a spreadsheet tool; it’s a powerful instrument for data analysis.
Whether you’re analyzing financial data, conducting research, or performing any statistical analysis, Excel’s variance calculation feature can be a powerful tool in your arsenal. Start applying these techniques to your spreadsheets today, and unlock new insights from your data like never before.