If you’ve ever wondered how businesses and analysts determine their year-on-year performance, you’re in the right place. Year-over-year growth Excel is a fundamental metric used to assess the percentage change in data over a 12-month period, allowing you to analyze trends, monitor progress, and make informed decisions.
Whether you’re a student, professional, or entrepreneur, understanding how to calculate YoY growth in Excel is an essential skill that empowers you to evaluate business performance, track sales, monitor revenue, and project future outcomes with confidence.
In this in-depth guide, we’ll take you step-by-step through various methods of calculating year-over-year growth in Excel. So, let’s dive into the world of data analysis and unravel the secrets behind YoY calculation in Excel!!
Understanding Year-over-Year Growth:
Year-over-Year growth formula Excel, often abbreviated as YoY, is a vital metric employed in business analysis and financial reporting. It facilitates the comparison of data for two consecutive years to ascertain the percentage change over that period. This calculation enables businesses to gauge their progress, identify trends, and make informed decisions based on the data.
Different Methods for How to Calculate Year on Year Growth in Excel
We’re going to explain the methods using a dataset that has information about a company’s Sales Amount from 2014 to 2019.
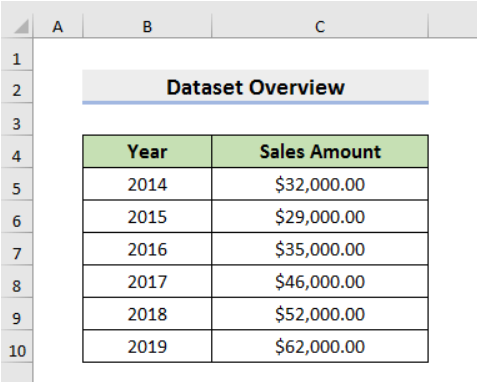
This dataset will help us understand how the company’s sales changed over those years. So, get ready to explore and learn!
Method 1: Using the Traditional Formula
To calculate year-over-year growth in Excel, the traditional formula is a widely used and straightforward approach. Follow the steps below to understand and implement this method:
Create a Column for YoY Growth
To begin, insert a new column in your Excel spreadsheet where we will calculate the Year-over-Year growth.
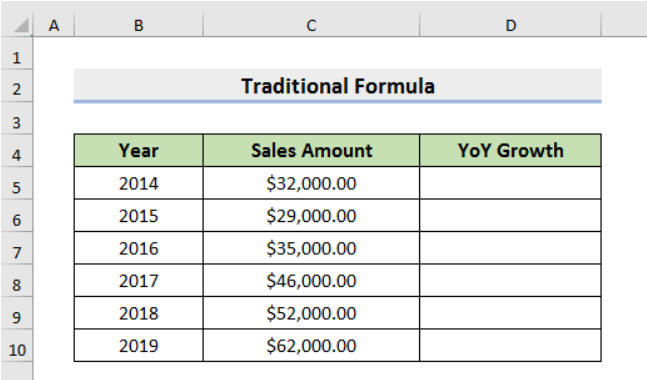
Implement the Traditional Formula
Select Cell D6 (assuming the first year’s growth will be calculated in Cell D6) and input the following formula:
=(C6-C5)/C5

This formula calculates year-over-year growth percentage formula Excel by subtracting the previous year’s value (C5) from the current year’s (C6) and dividing the result by the previous year’s value.
Note: The first cell of the YoY Growth column will be empty since there is no previous year’s value for the first year.
Observe the Result
Press Enter to see the result of the YoY growth for the first year. The value displayed will be in decimal form.

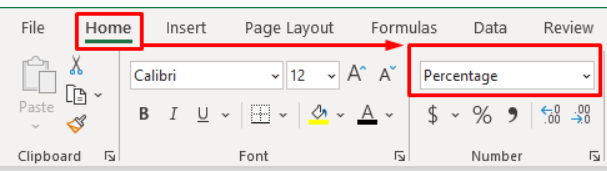
Convert the Number Format to Percentage
To present the YoY growth as a percentage, change the number format of Cell D6. Go to the Home tab, select Percentage from the Number section,

the result will be displayed as a percentage.

Extend the Formula
Drag the Fill Handle down to autofill the formula for subsequent years (till 2019) and observe the YoY growth for each year. The percentage values will now be calculated for each year in the YoY Growth column.

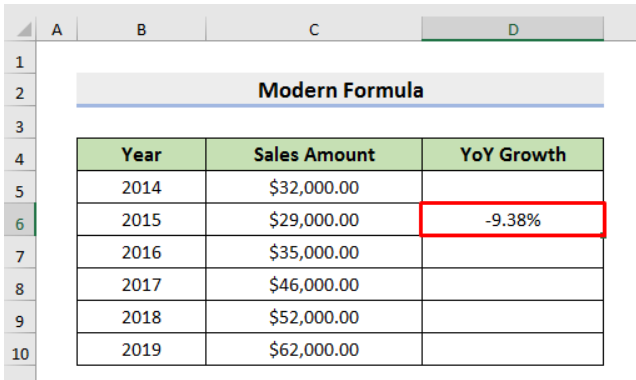
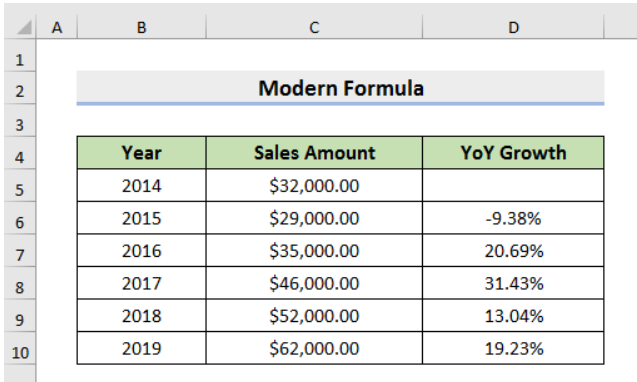
Method 2: Using the Modern Formula
An alternative way to calculate year-over-year growth in Excel is by utilizing a different formula. This method involves calculating the ratio of the new value to the old value and then subtracting 1. The general form of the formula is:
=(New Value/Old Value)-1
Now, let’s apply this formula to our dataset:
Implement the Modern Formula
Select Cell D6 (again assuming the first year’s growth will be calculated in Cell D6) and input the following formula:
=(C6/C5)-1

This formula calculates the YoY growth percentage by dividing the current year’s value (C6) by the previous year’s (C5) and subtracting 1 from the result.
Observe the Result
Press Enter using the modern formula to see the YoY growth percentage for the first year. The value displayed will also be in decimal form.

Convert to Percentage
As before, change the number format to the percentage by going to the Home tab and selecting Percentage from the Number field.
The result will now be displayed as a percentage.
Extend the Formula
Use the Fill Handle to auto-fill the formula for the subsequent years (till 2019) and view the YoY growth for each year. The percentage values for YoY growth will be calculated for each year in the YoY Growth column.
Conclusion
By employing either the traditional or modern formula, you can calculate Year-over-Year growth in Excel accurately. These methods provide valuable insights into the company’s performance trends, making them essential data analysis and decision-making tools.
Whether you’re analyzing sales figures, revenue, or any other metric, understanding yoy growth Excel will help you identify patterns and make informed business choices. Excel’s flexibility and formula capabilities make it a powerful tool for any analyst or business owner seeking to gain a competitive edge.