Whether you’re a student conducting scientific experiments, a researcher analyzing data, or a professional in a data-driven industry, understanding and quantifying uncertainty is essential for accurate decision-making and effective communication of results. Excel, with its vast array of mathematical functions and intuitive interface, offers a powerful toolset for uncertainty analysis.
In this blog post, we will take you on a step-by-step journey through the process of calculating uncertainty in Excel, exploring various methods and techniques along the way. We will cover key concepts such as measurement error, precision, and confidence intervals, and provide you with practical examples and hands-on exercises to reinforce your understanding.
By the end of this guide, you will have the knowledge and skills to confidently assess and communicate the uncertainty associated with your data, empowering you to make informed decisions and present robust findings. So, grab your Excel spreadsheets, and let’s dive into the fascinating world of uncertainty analysis!
Understanding Uncertainty
Uncertainty is an inherent part of any measurement or calculation process. It accounts for unavoidable errors, limitations, and variations in data. By quantifying uncertainty, we can assess the reliability and accuracy of our results.
Types of Uncertainty
There are two primary types of uncertainty:
Random Uncertainty
Random uncertainty, also known as statistical uncertainty or precision, arises due to the inherent variability in measurements. It occurs when repeated measurements of the same quantity yield different results. Random uncertainty can be minimized by increasing the number of measurements or using more precise instruments.
Systematic Uncertainty
Systematic uncertainty, also called systematic error or bias, arises from flaws or limitations in the measurement process itself. It affects measurements consistently in the same direction. Systematic uncertainty can be reduced by calibrating instruments, improving experimental techniques, or identifying and correcting systematic errors.
Calculating Uncertainty Using Excel
Excel provides several methods to calculate uncertainty. Let’s explore three commonly used methods:
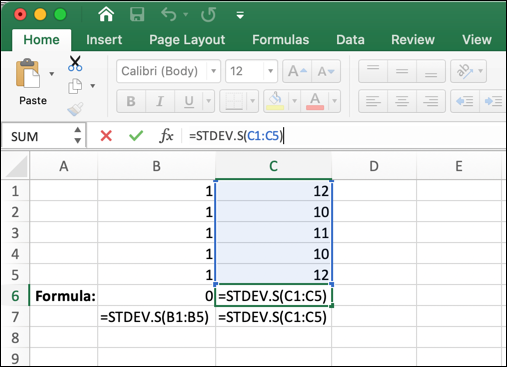
Method 1: Standard Deviation
The standard deviation is a measure of the dispersion of a dataset. It quantifies how much the individual data points deviate from the mean. In Excel, you can use the STDEV.S function to calculate the standard deviation. The higher the standard deviation, the greater the uncertainty.
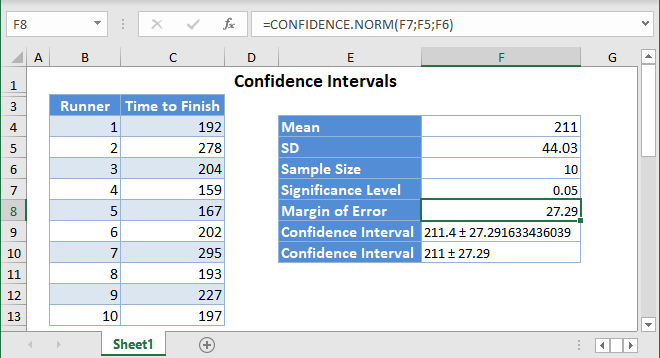
Method 2: Confidence Interval
The confidence interval provides a range of values within which the true value is likely to lie. It takes into account both the sample size and the variability of the data. Excel offers the CONFIDENCE function to calculate the confidence interval. A wider confidence interval indicates higher uncertainty.
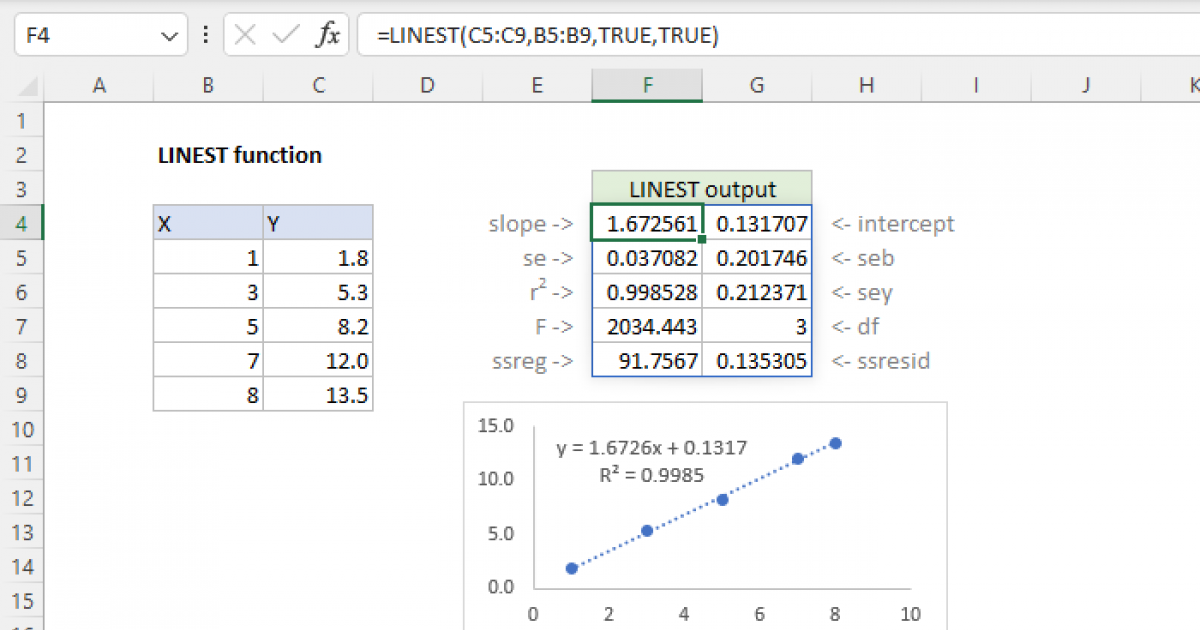
Method 3: Regression Analysis
Regression analysis helps in understanding the relationship between variables and predicting values based on that relationship. Excel’s regression analysis tools, such as the LINEST function, can estimate uncertainty by analyzing the scatter of data points around the regression line.
Interpreting Uncertainty Results
Once you calculate uncertainty using Excel, it’s essential to interpret the results correctly. Uncertainty values provide a measure of the expected error or deviation in your data. The interpretation depends on the specific context and the goals of your analysis. Consider the magnitude of uncertainty, compare it with the expected accuracy requirements, and assess the impact on decision-making.
Importance of Uncertainty in Decision Making
Uncertainty plays a vital role in decision-making, particularly in fields such as finance, engineering, and research. Decision-makers need to consider uncertainty to evaluate risks, optimize processes, and make informed choices. Accurate uncertainty calculations provide a more comprehensive understanding of the potential outcomes and help in selecting the best course of action.
Tips for Effective Uncertainty Calculation
To ensure accurate and reliable uncertainty calculations in Excel, consider the following tips:
- Use sufficient data points for a robust analysis.
- Employ appropriate statistical functions and formulas.
- Validate your results by cross-checking with other methods or software.
- Document your methodology and assumptions for future reference.
- Regularly update and refine your uncertainty calculations as new data becomes available.
Limitations of Excel in Uncertainty Analysis
While Excel is a powerful tool for data analysis, it has certain limitations when it comes to uncertainty analysis. Excel’s built-in functions provide basic statistical measures, but for advanced uncertainty analysis or specialized techniques, dedicated software or programming languages may be more suitable. It’s important to understand the scope and limitations of Excel and choose the right tools for your specific analysis requirements.
Conclusion
Calculating uncertainty in Excel is a valuable skill for researchers, analysts, and decision-makers. By utilizing the various functions and formulas available, you can quantify and analyze uncertainty in your data effectively.
Remember to interpret the results in the appropriate context and consider the limitations of Excel for advanced uncertainty analysis. Accurate uncertainty calculations lead to more informed decision-making and improved data reliability.